


Spatial-Temporal Variation Characteristics and Pollutants Analysis of Urban PM2.5 in the Yellow River Basin
-
摘要: 分析揭示黄河流域城市PM2.5时空分异特征,对打赢大气污染防治攻坚战,推动黄河流域空气污染跨区域协同治理机制的建立和完善,以及流域绿色高质量发展具有重要意义. 本文以中国空气质量在线监测分析平台456个监测站点的PM2.5浓度监测数据为基础,运用莫兰指数和标准差椭圆方法分析黄河流域70个城市2015—2021年PM2.5的时空分异特征、演变格局,并基于皮尔逊相关系数分析法对其污染源进行解析. 结果表明:①PM2.5浓度的月度、季节变化特征明显. 月均浓度呈底部宽缓的“U”型分布,12月或1月达到最大值;冬季平均浓度最高、春秋季次之、夏季最低,冬季浓度是夏季的1.9~2.6倍;年均PM2.5浓度整体趋降,且表现为下游>中游>上游的空间分异性. ②PM2.5的空间聚集表现为上游“低—低”集聚、下游“高—高”集聚、中游城市的空间聚集特征不显著,空间正相关集聚的城市数量以先增后减的趋势变化,负相关集聚特征的城市较少. ③PM2.5空间分布格局总体呈“西北—东南”的地理空间走向,其浓度的分布在地理空间上分散化,但分布范围趋于缩减. ④上游城市PM2.5污染源复杂多样,主要有PM10、NO2、CO和SO2,中游城市PM2.5污染主要来源于PM10、NO2和CO,而下游城市为PM10、CO. 研究显示,黄河流域城市PM2.5浓度的时空分异性明显,上下游存在显著的空间正相关聚集,城市污染联防联控对流域空气质量的改善发挥重要作用.Abstract: Analyzing and revealing the spatial and temporal characteristics of PM2.5 in cities of the Yellow River Basin is of great significance for winning the battle against air pollution and promoting the establishment and improvement of the cross-regional cooperative control mechanism of air pollution and the green high-quality development. Based on the PM2.5 concentration monitoring data of 456 monitoring stations, this paper analyzed the spatial and temporal variation characteristics and evolution pattern of PM2.5 in 70 cities in the Yellow River Basin from 2015 to 2021 by using the Moran index and standard deviation ellipse method, and identified the pollution sources by Pearson correlation coefficient analysis method. The results showed that: (1) PM2.5 concentration reflected monthly and seasonal changes. The monthly average concentration showed a ‘U-shaped’ distribution with a wide and slow bottom, reaching the maximum in December or January. In terms of seasons, the average concentration in winter was the highest (1.9-2.6 times that of summer), followed by spring and autumn, and the lowest in summer. The annual average concentration decreased in general, showing a spatial differentiation of downstream > midstream > upstream. (2) The spatial aggregation of PM2.5 was characterized by ‘low-low’ agglomeration in the upstream, ‘high-high’ agglomeration in the downstream, and insignificant spatial aggregation in the midstream. The number of cities with positive spatial correlation agglomeration increased first and then decreased, while the number of cities with negative spatial correlation agglomeration was relatively small. (3) The spatial distribution pattern of PM2.5 generally followed a ‘northwest-southeast’ geographical spatial trend, and the concentration distribution showed the characteristics of geographical spatial decentralization and gradual reduction of distribution range. (4) PM2.5 pollution in upstream cities was complex and diverse, mainly including PM10, NO2, CO and SO2. PM10, NO2 and CO were the main sources in midstream cities, and PM10 and CO were the main sources in downstream cities. The spatial heterogeneity of PM2.5 concentration in cities of the Yellow River Basin was obvious, and there was a significant positive spatial correlation agglomeration in the upstream and downstream. Collaborative prevention and control in cities will help to further improve air quality in the Yellow River Basin.
-
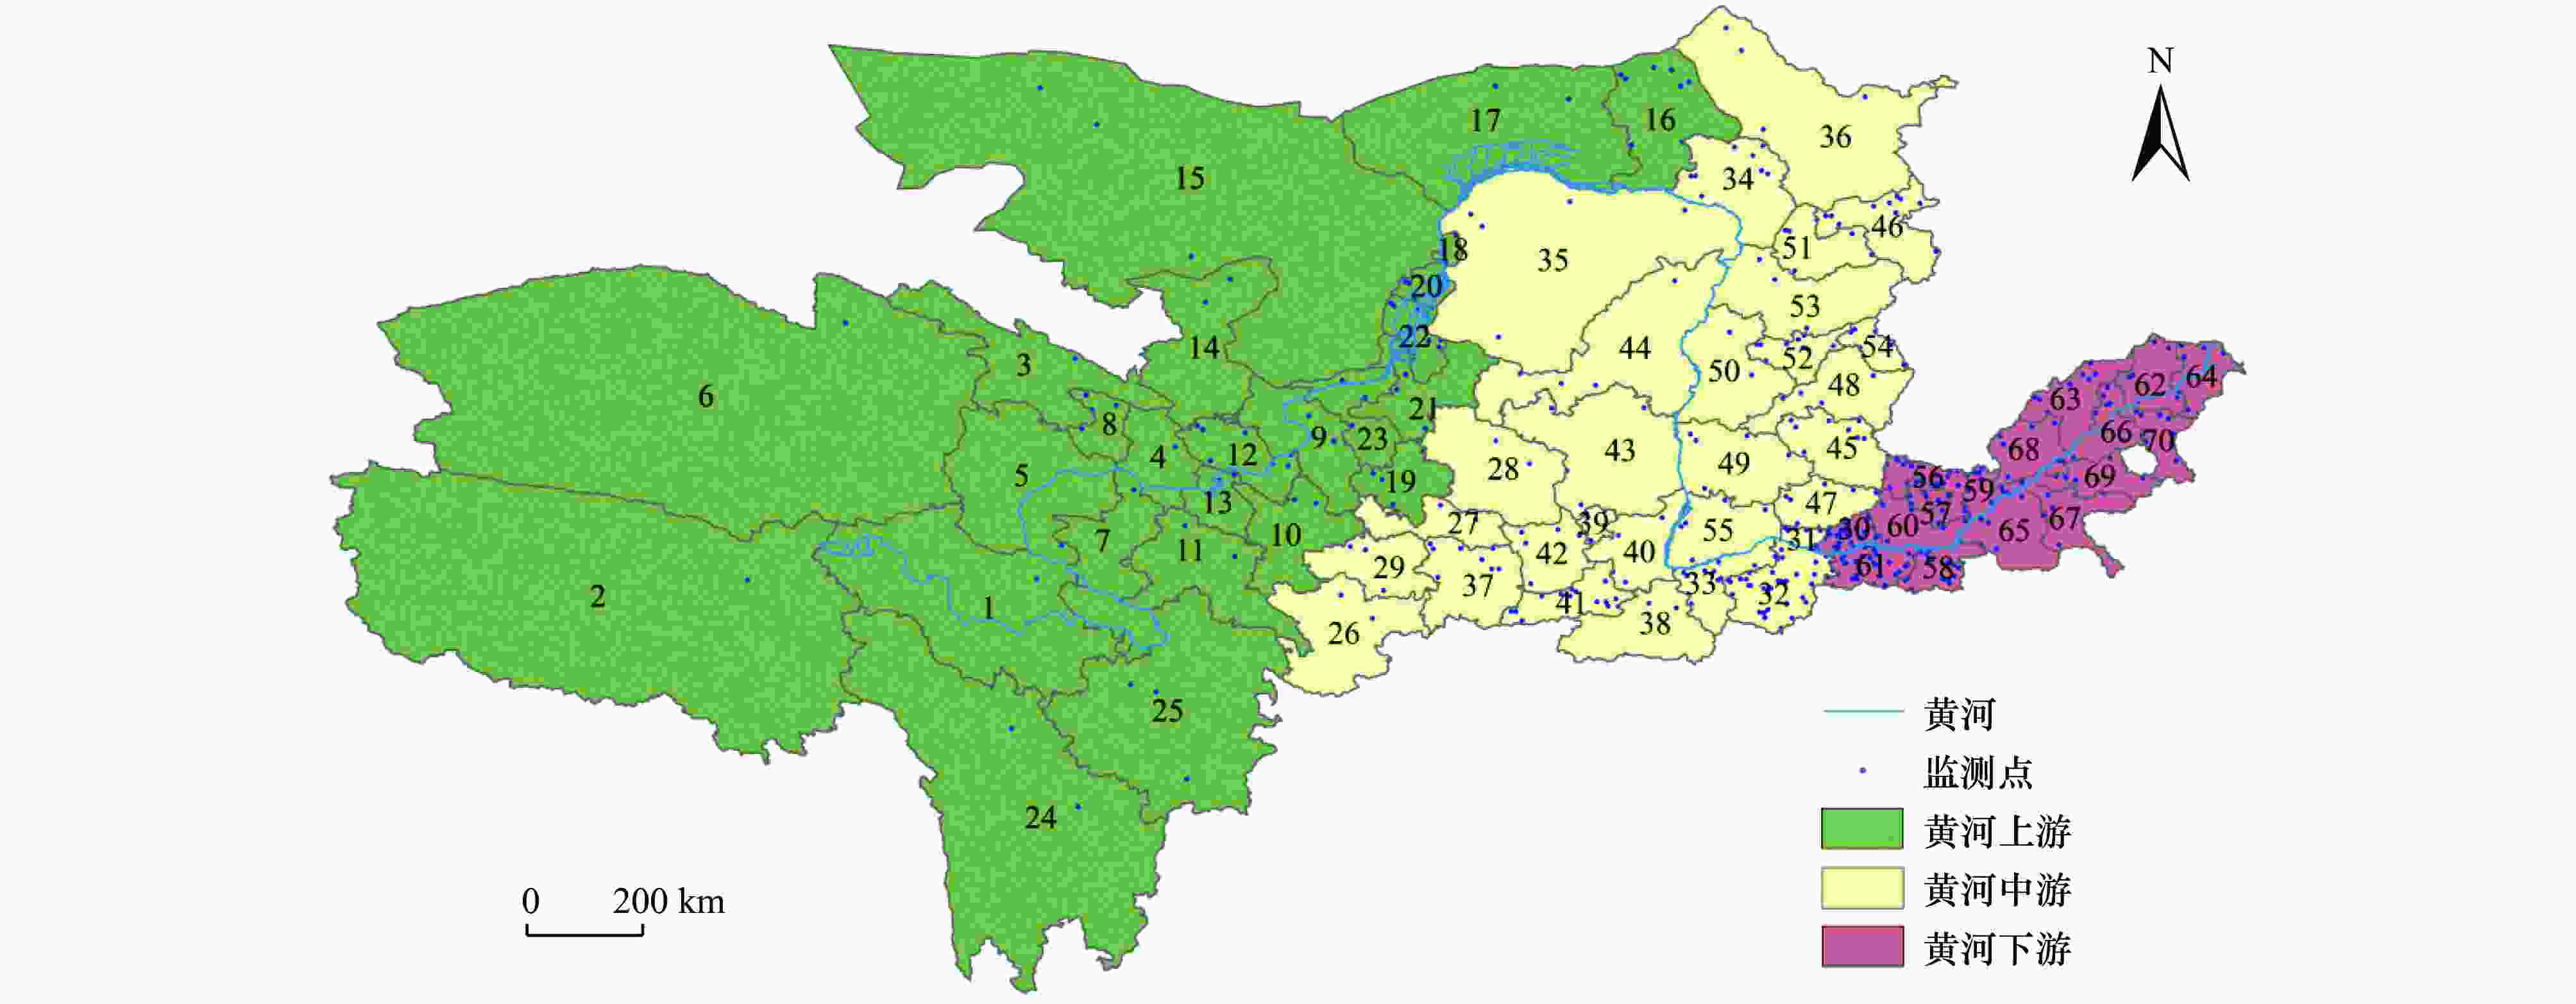
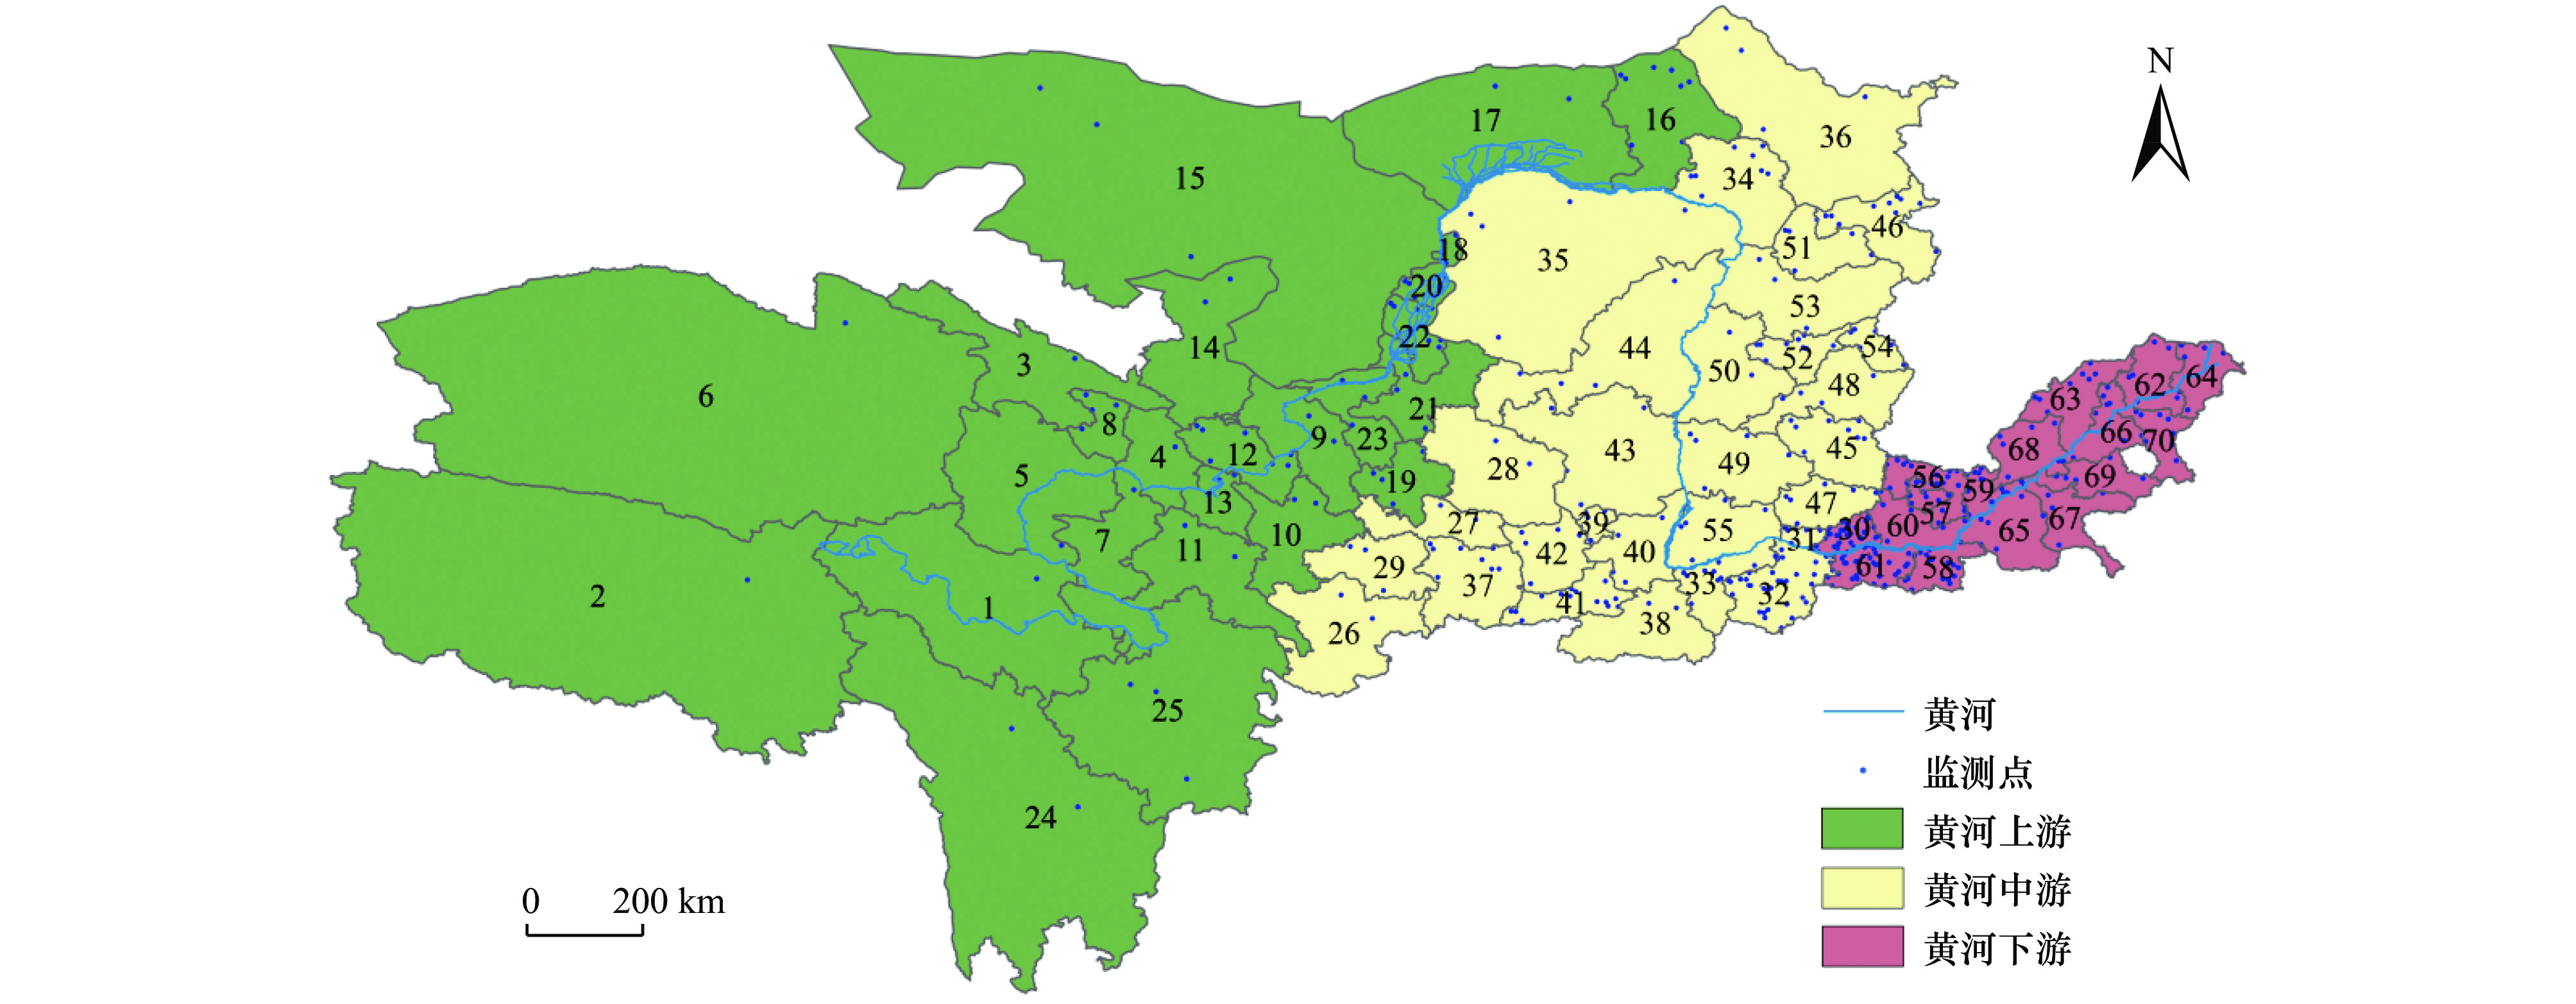
图 1 黄河流域范围及监测站点分布
注:1—果洛藏族自治州;2—玉树藏族自治州;3—海北藏族自治州;4—海东市;5—海南藏族自治州;6—海西蒙古族藏族自治州;7—黄南藏族自治州;8—西宁市;9—白银市;10—定西市;11—甘南藏族自治州;12—兰州市;13—临夏回族自治州;14—武威市;15—阿拉善盟;16—包头市;17—巴彦淖尔市;18—乌海市;19—固原市;20—石嘴山市;21—吴忠市;22—银川市;23—中卫市;24—甘孜藏族自治州;25—阿坝藏族羌族自治州;26—陇南市;27—平凉市;28—庆阳市;29—天水市;30—焦作市;31—济源市;32—洛阳市;33—三门峡市;34—呼和浩特市;35—鄂尔多斯市;36—乌兰察布市;37—宝鸡市;38—商洛市;39—铜川市;40—渭南市;41—西安市;42—咸阳市;43—延安市;44—榆林市;45—长治市;46—大同市;47—晋城市;48—晋中市;49—临汾市;50—吕梁市;51—朔州市;52—太原市;53—忻州市;54—阳泉市;55—运城市;56—安阳市;57—鹤壁市;58—开封市;59—濮阳市;60—新乡市;61—郑州市;62—滨州市;63—德州市;64—东营市;65—菏泽市;66—济南市;67—济宁市;68—聊城市;69—泰安市;70—淄博市.
Figure 1. The range of Yellow River and distribution of monitoring sites
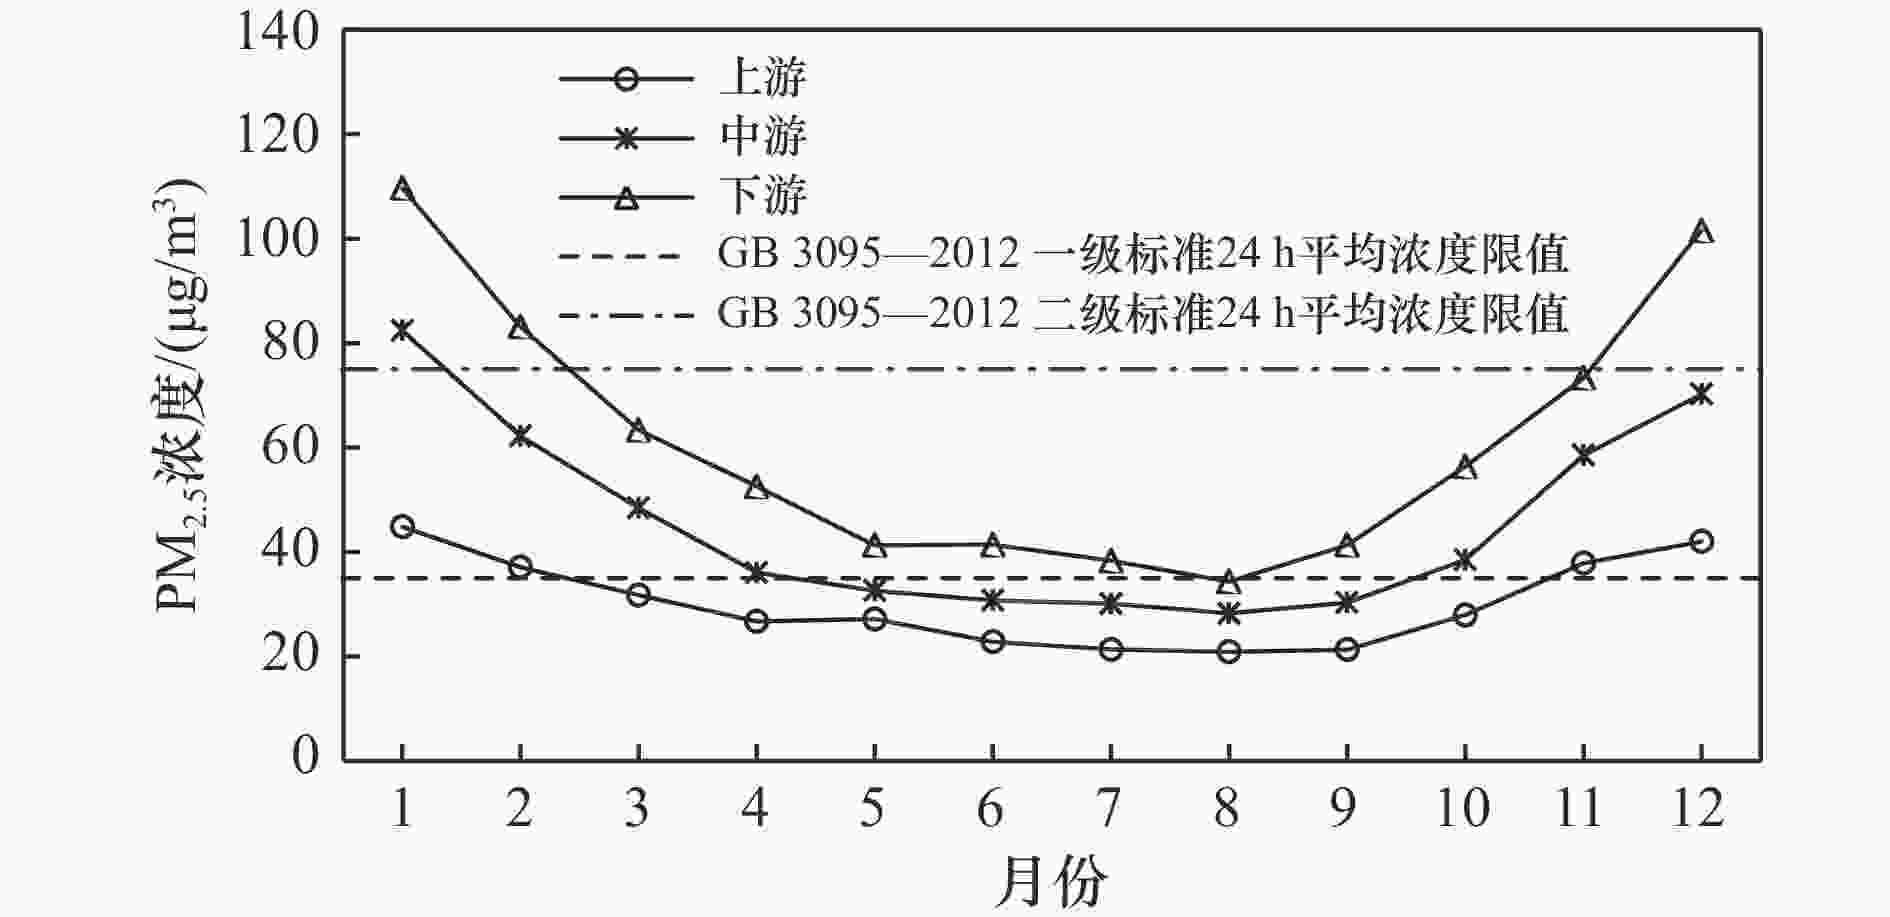
图 2 2015—2021年黄河流域城市PM2.5浓度月变化特征
Figure 2. Monthly variation of PM2.5 concentration in cities of the Yellow River Basin from 2015 to 2021

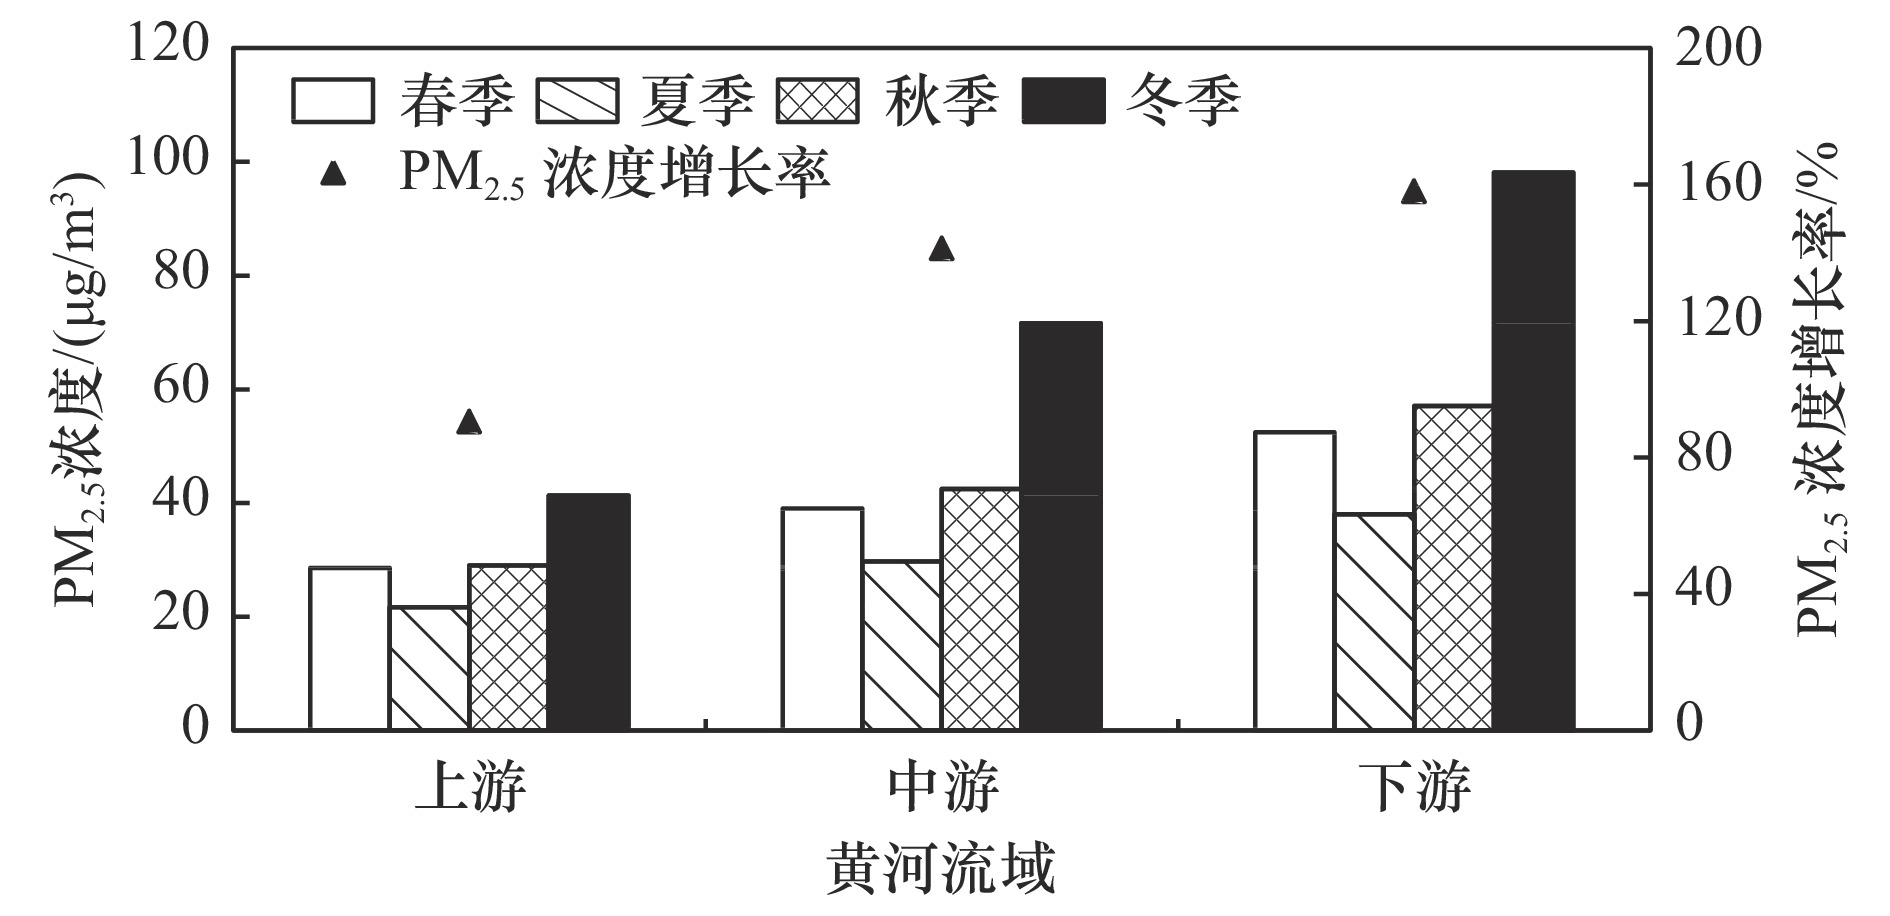
图 3 黄河流域城市PM2.5浓度季节变化特征
Figure 3. Seasonal variation of PM2.5 concentration in cities of the Yellow River Basin
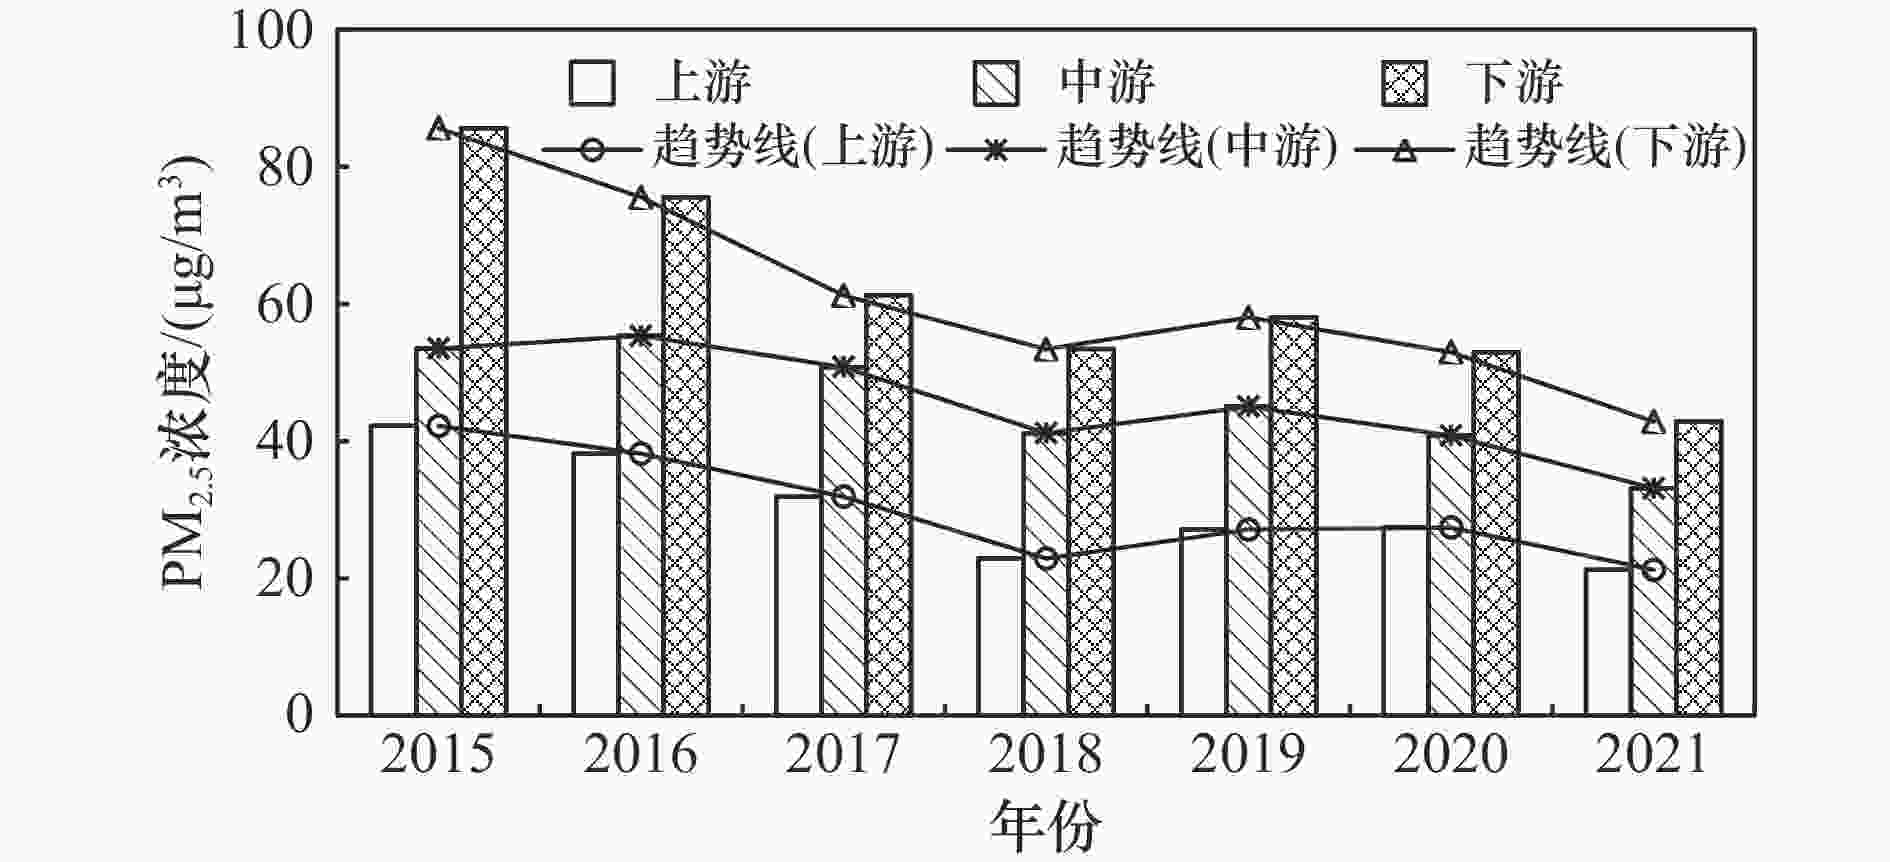
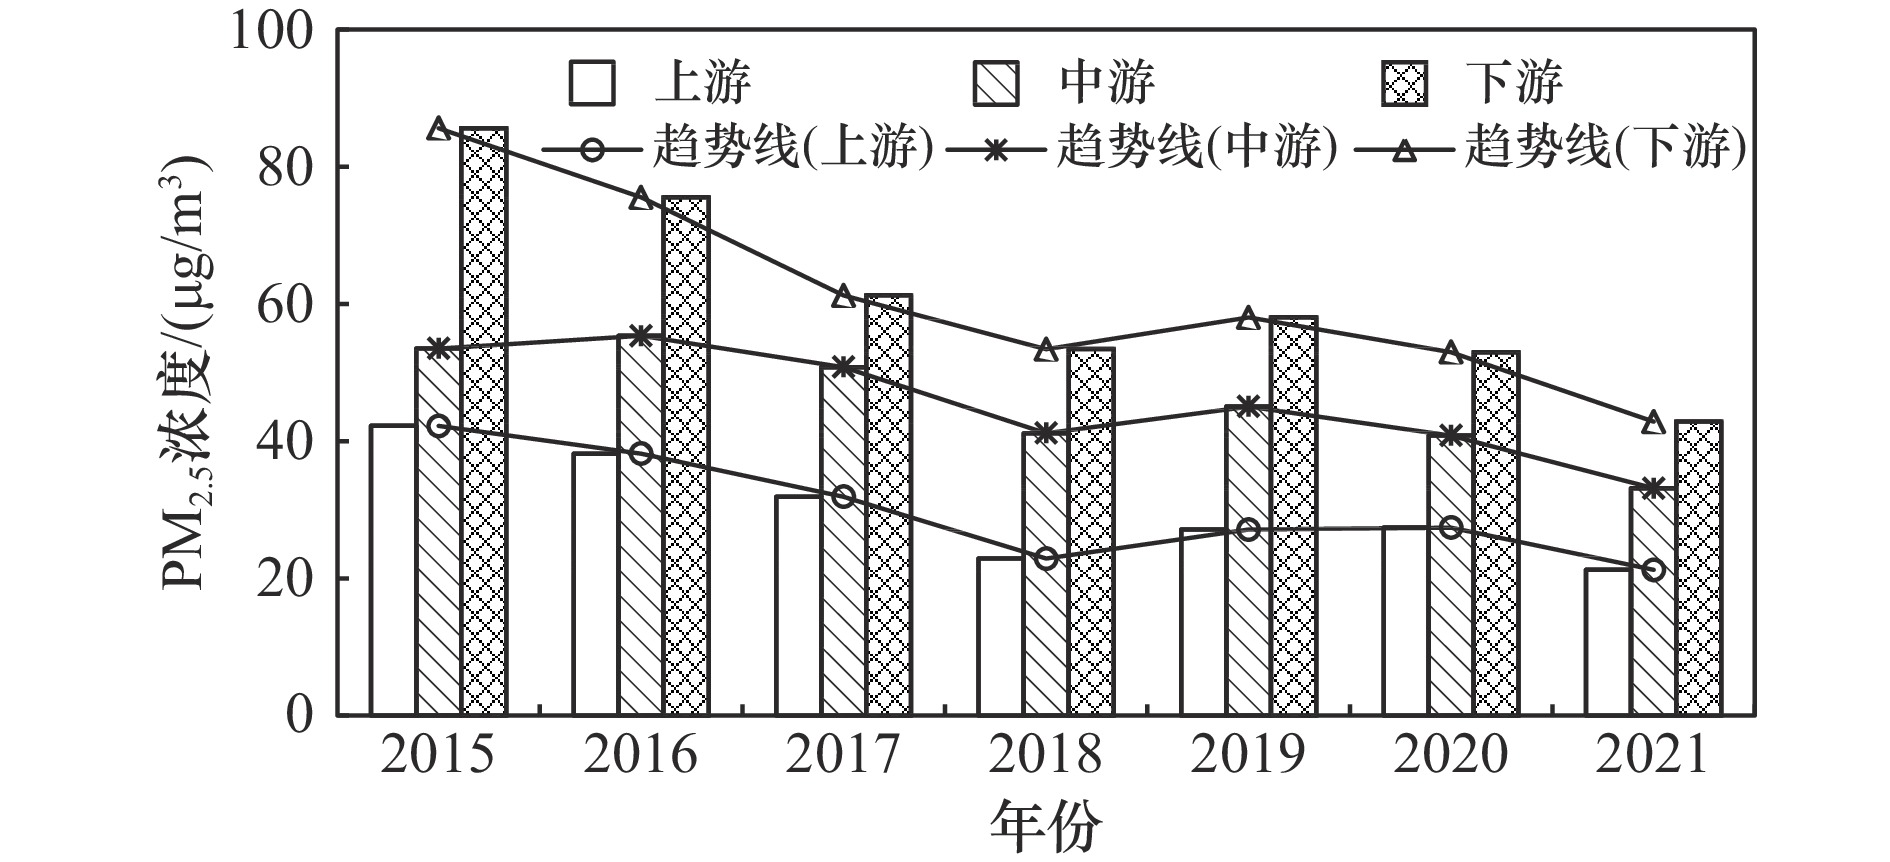
图 4 2015—2021黄河流域城市PM2.5浓度年变化特征
Figure 4. Annual variation of PM2.5 concentration in cities of the Yellow River Basin from 2015 to 2021
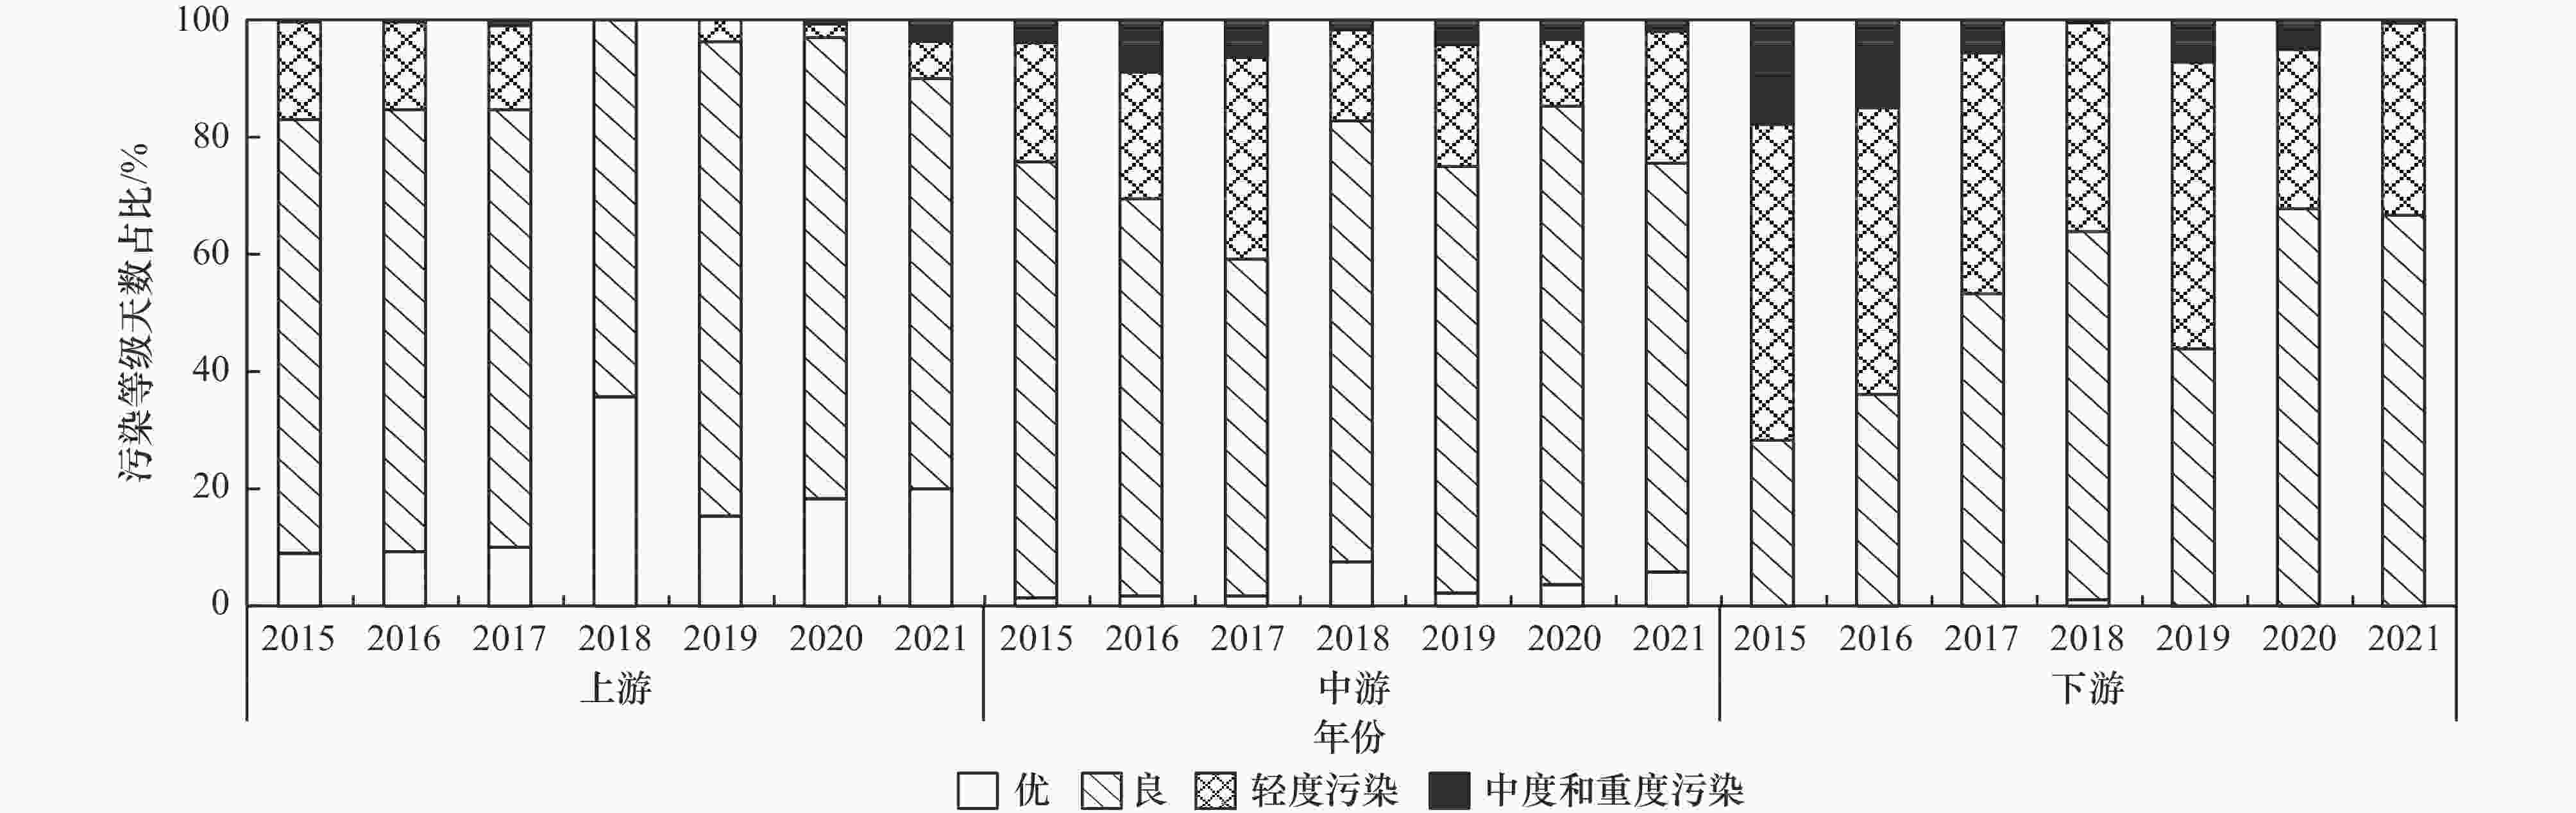
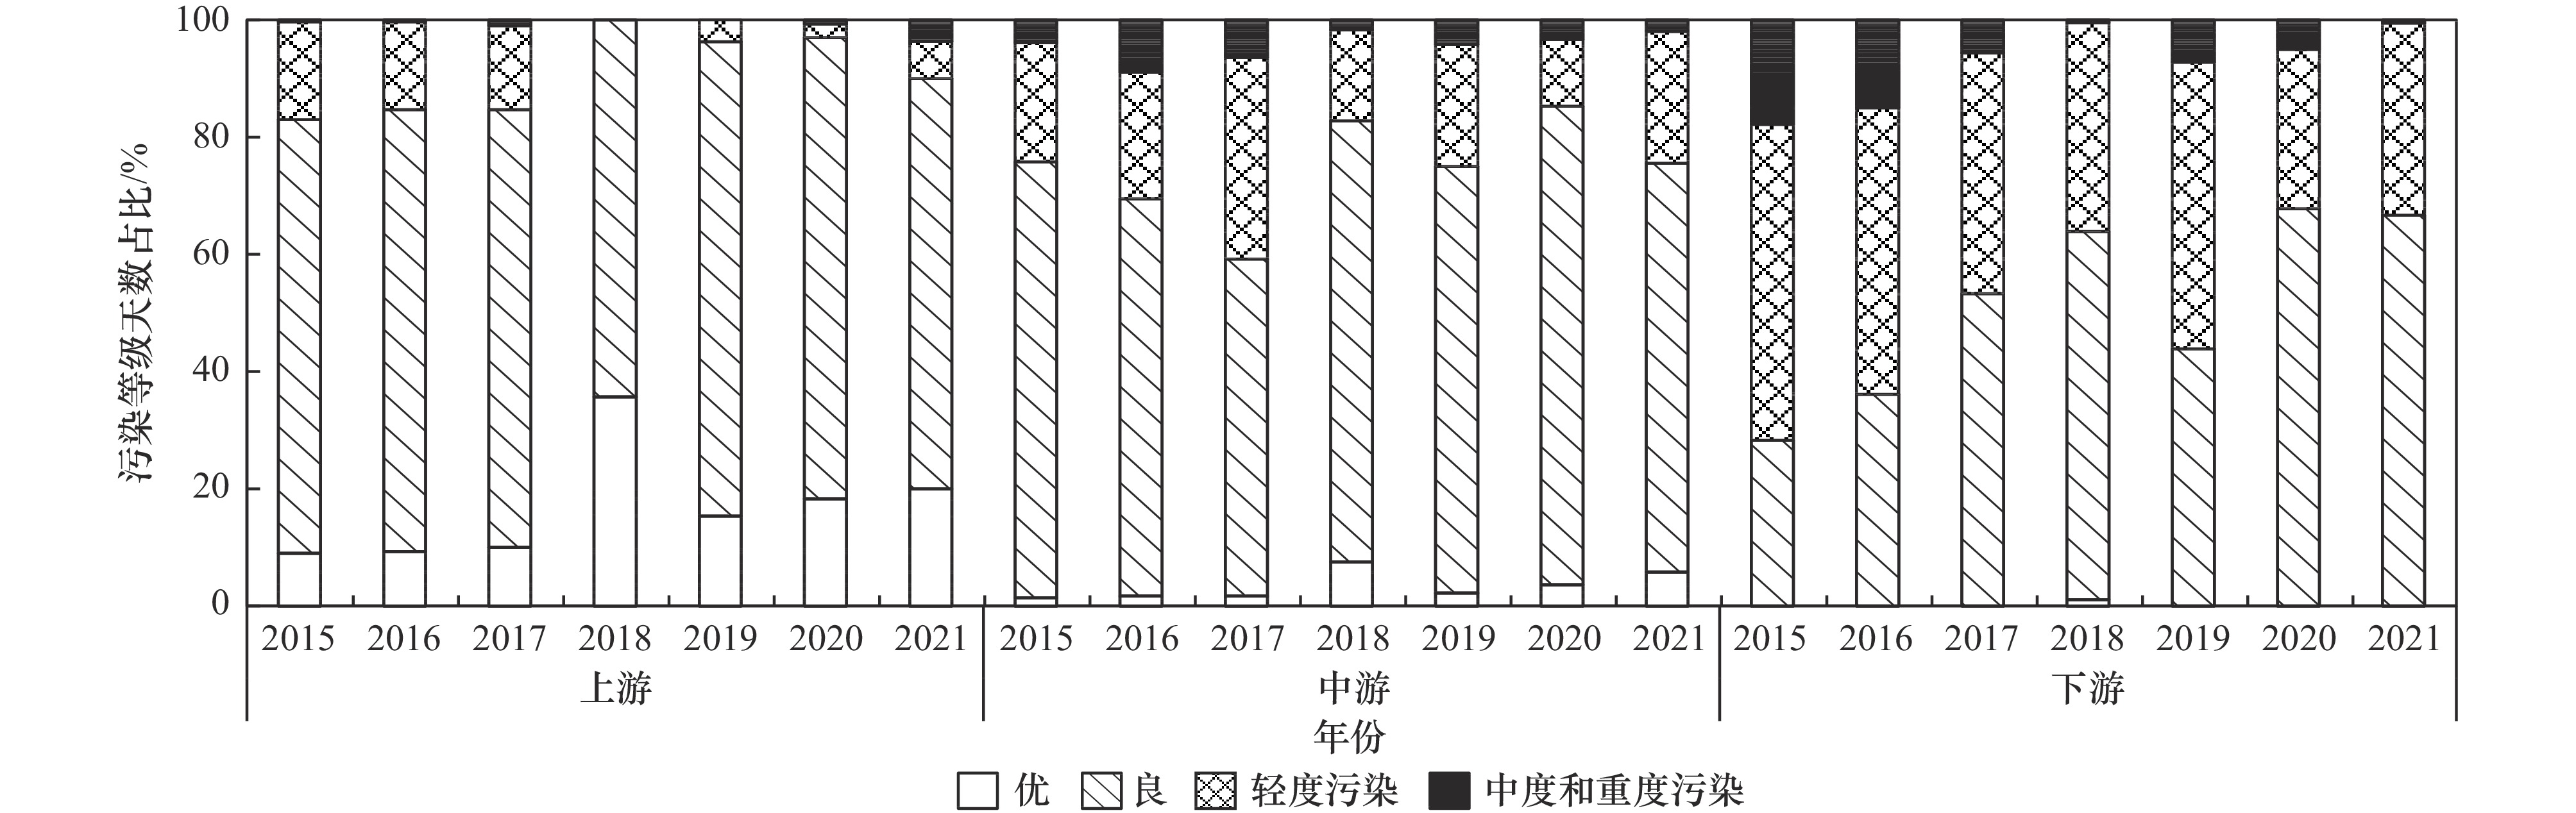
图 5 2015—2021年黄河流域城市PM2.5污染等级天数占比
Figure 5. Annual statistics of the proportion days covered by PM2.5 pollution in the Yellow River Basin from 2015 to 2021
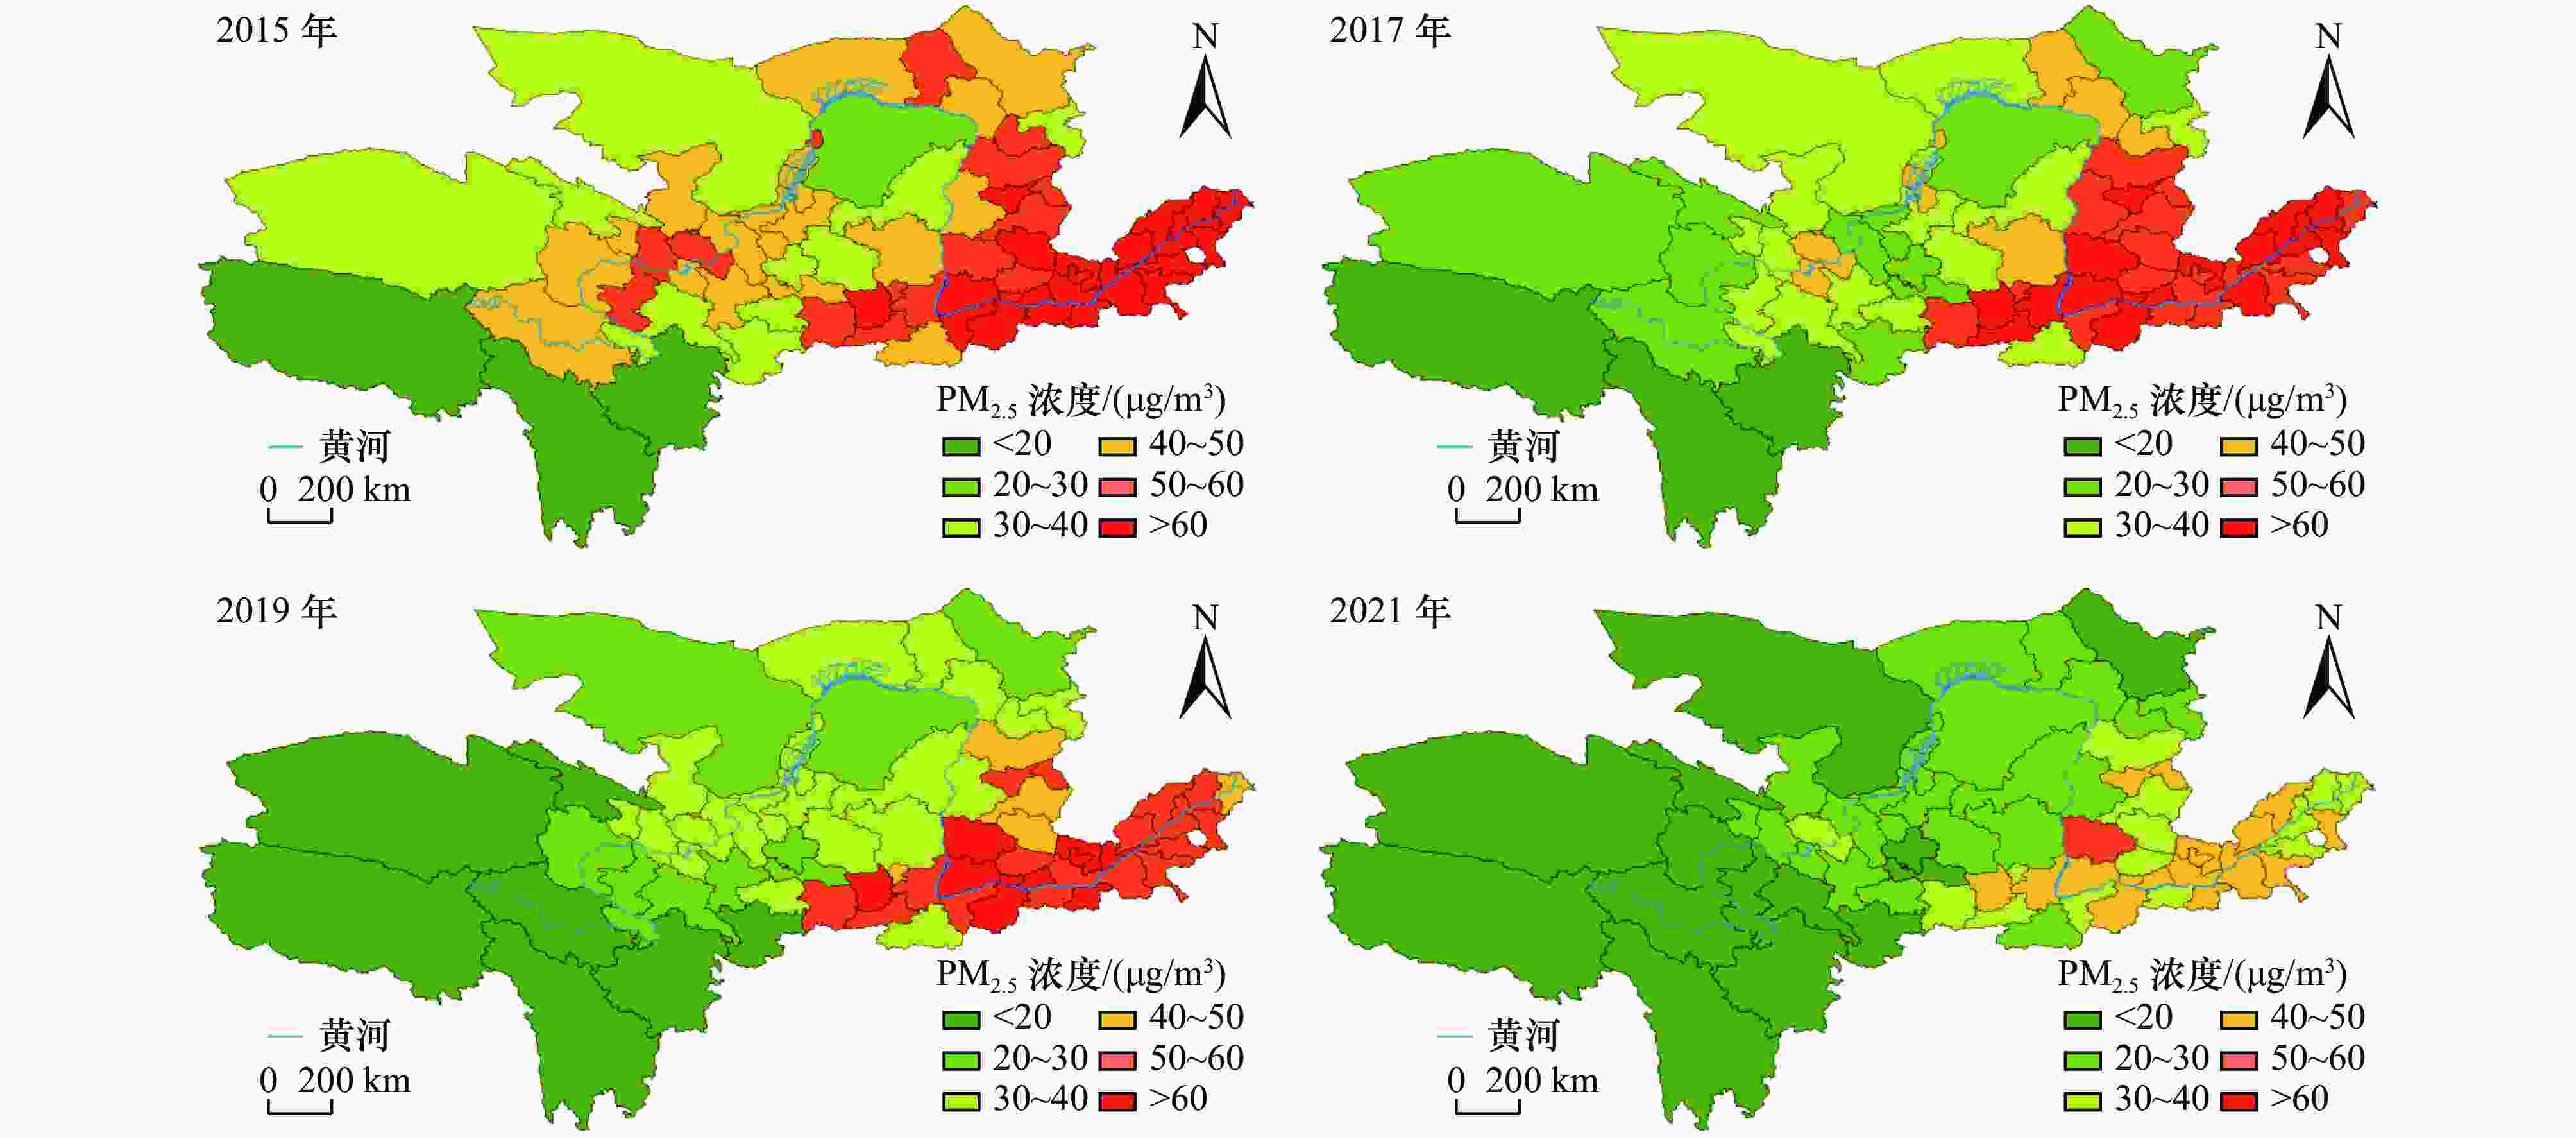
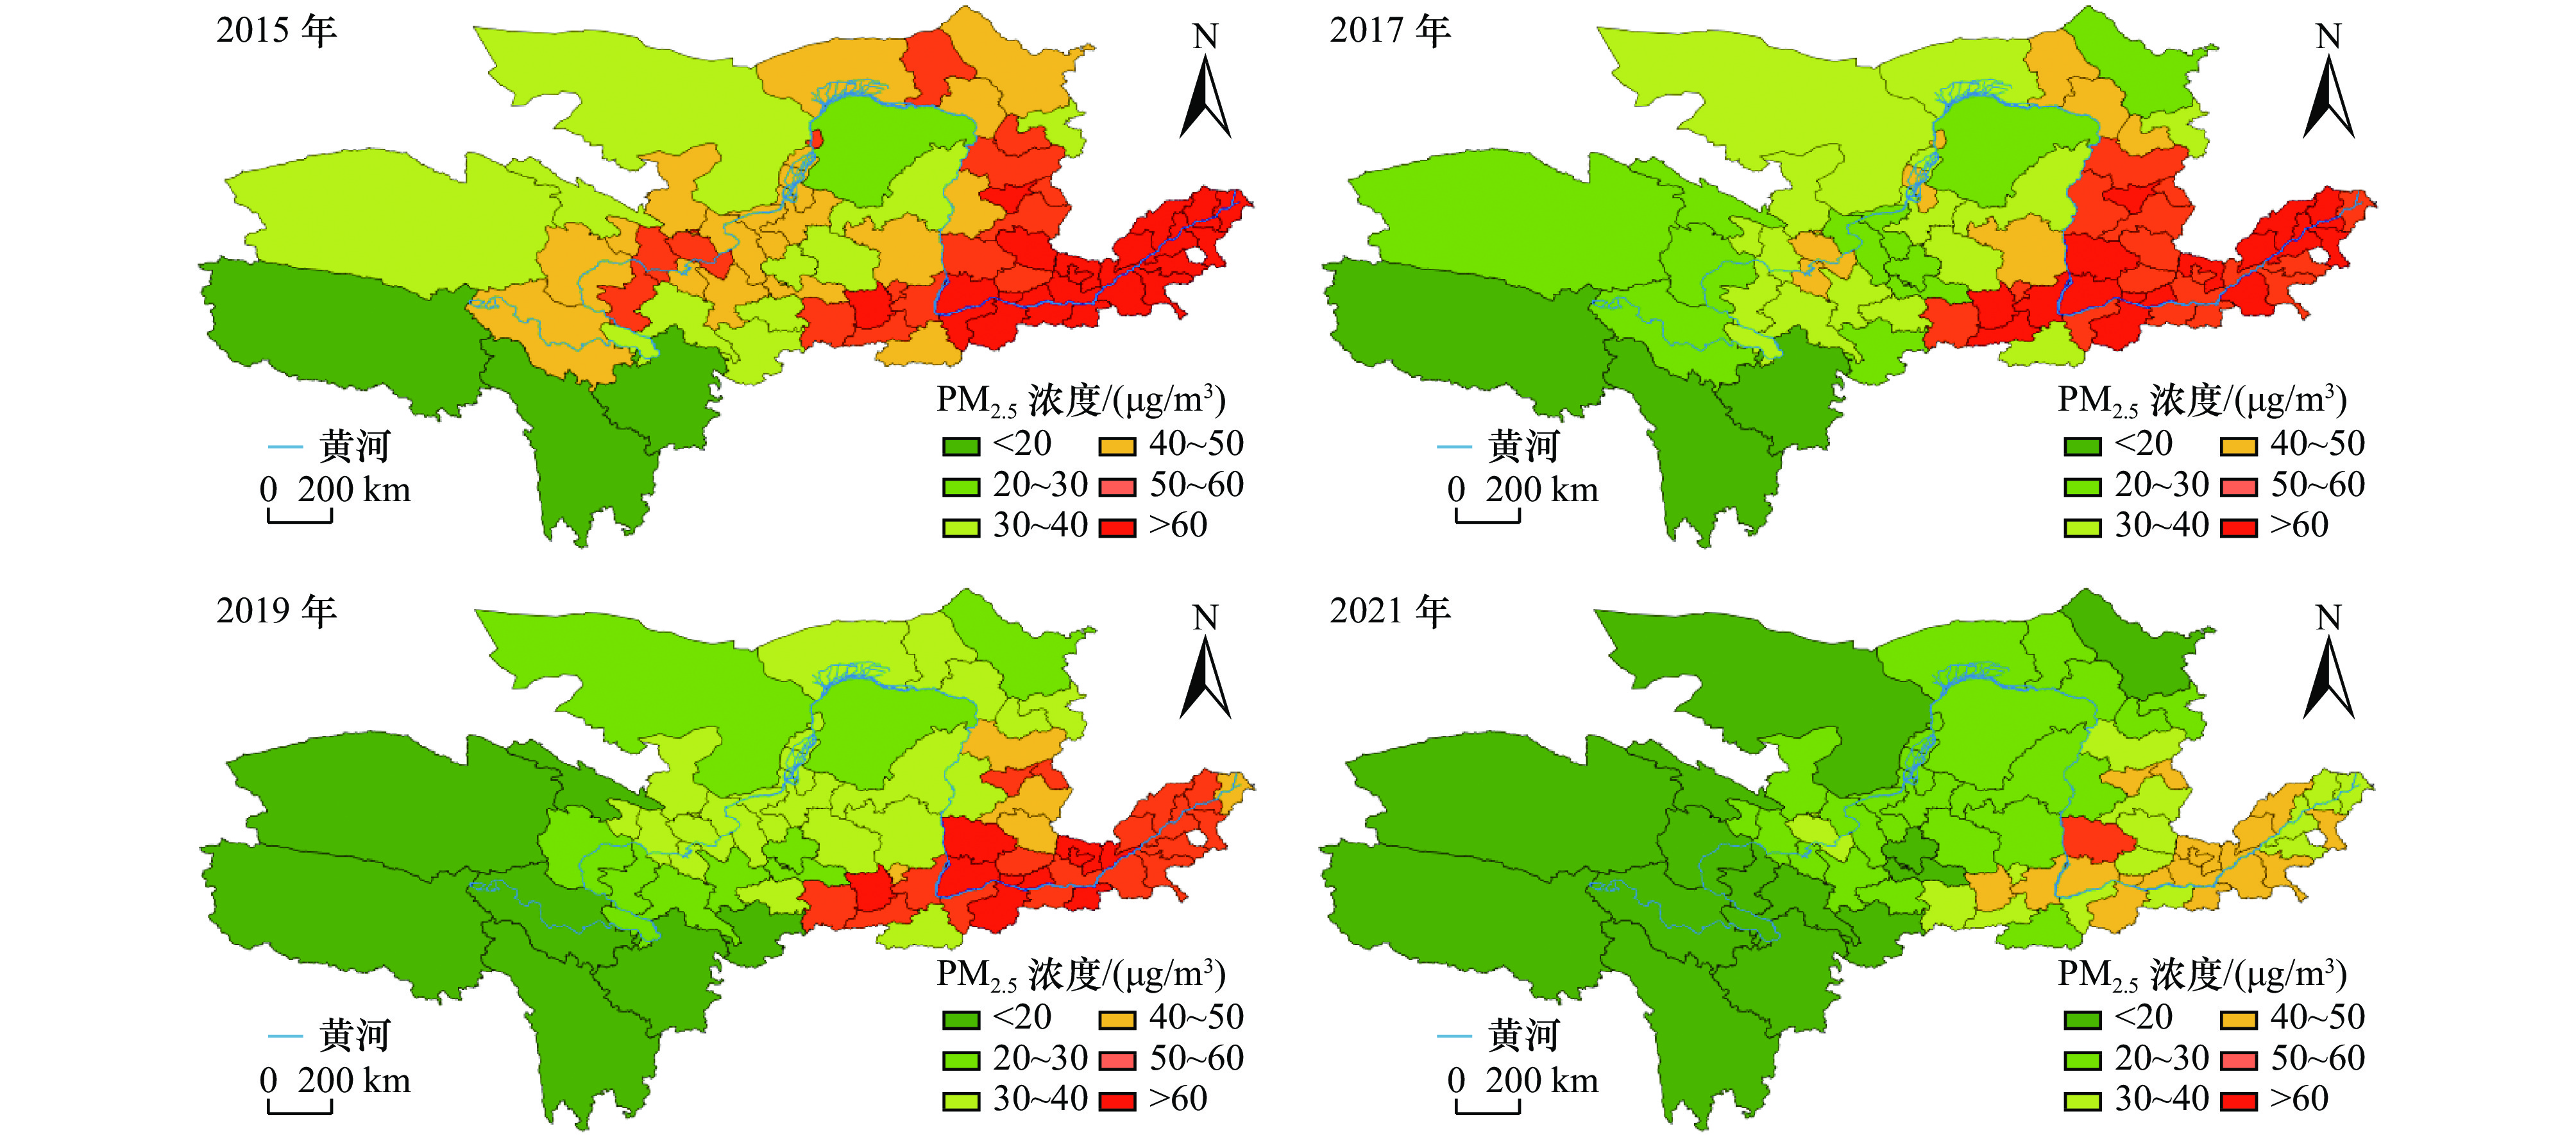
图 6 黄河流域城市PM2.5浓度的空间分布
Figure 6. Spatial distribution of PM2.5 concentration in cities of the Yellow River Basin

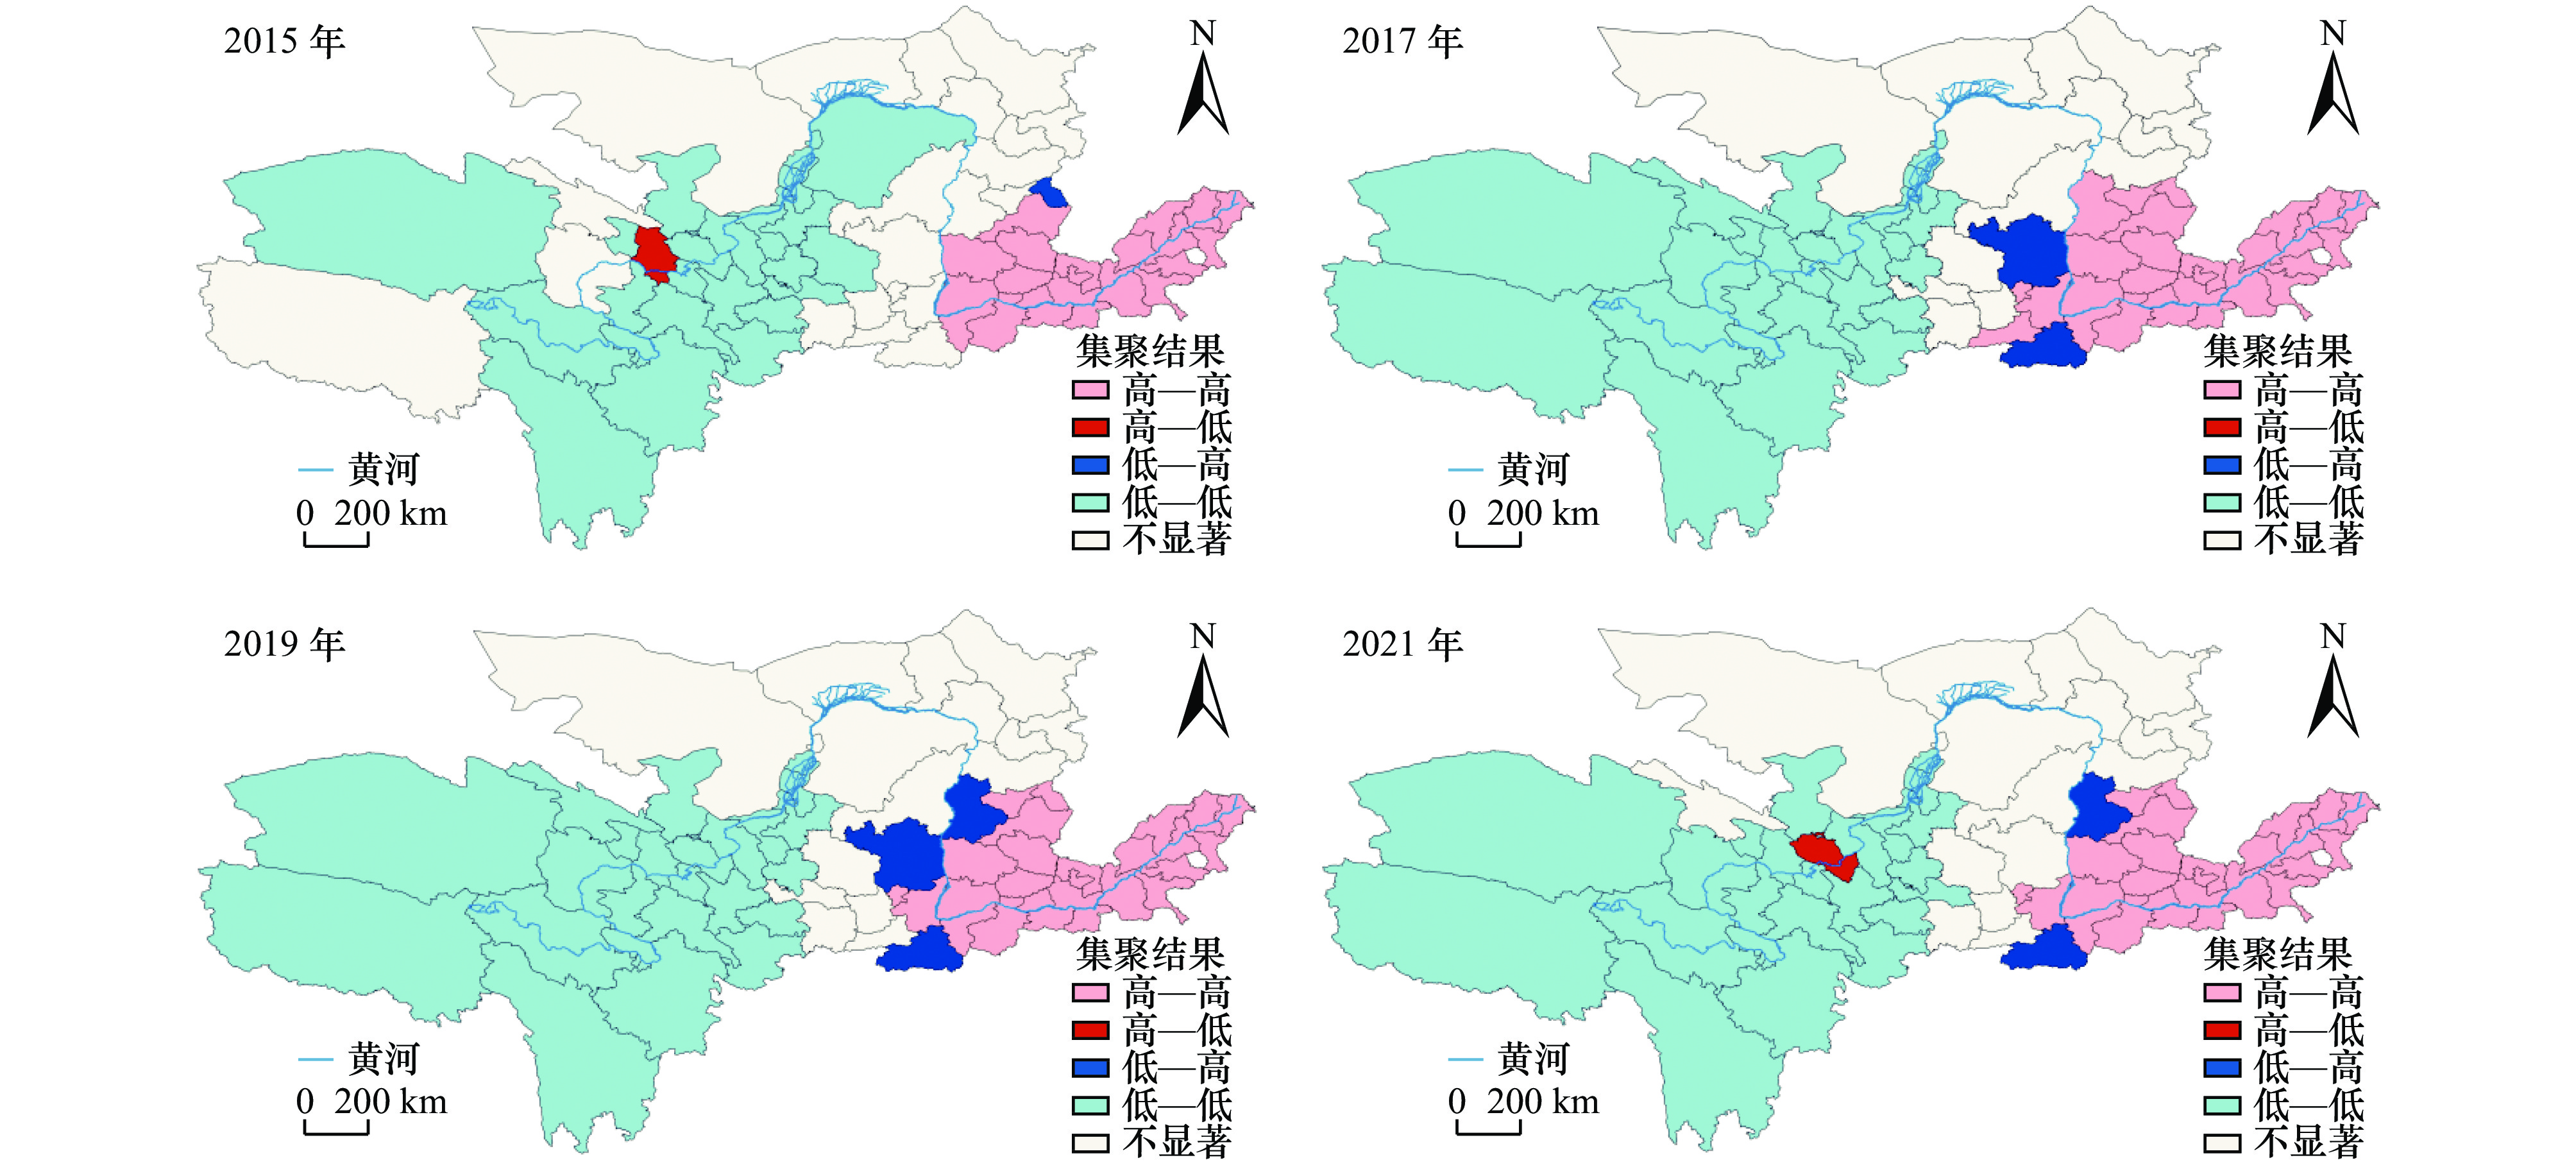
图 7 黄河流域城市PM2.5局部空间自相关LISA图
Figure 7. LISA distribution of PM2.5 in Yellow River Basin cities
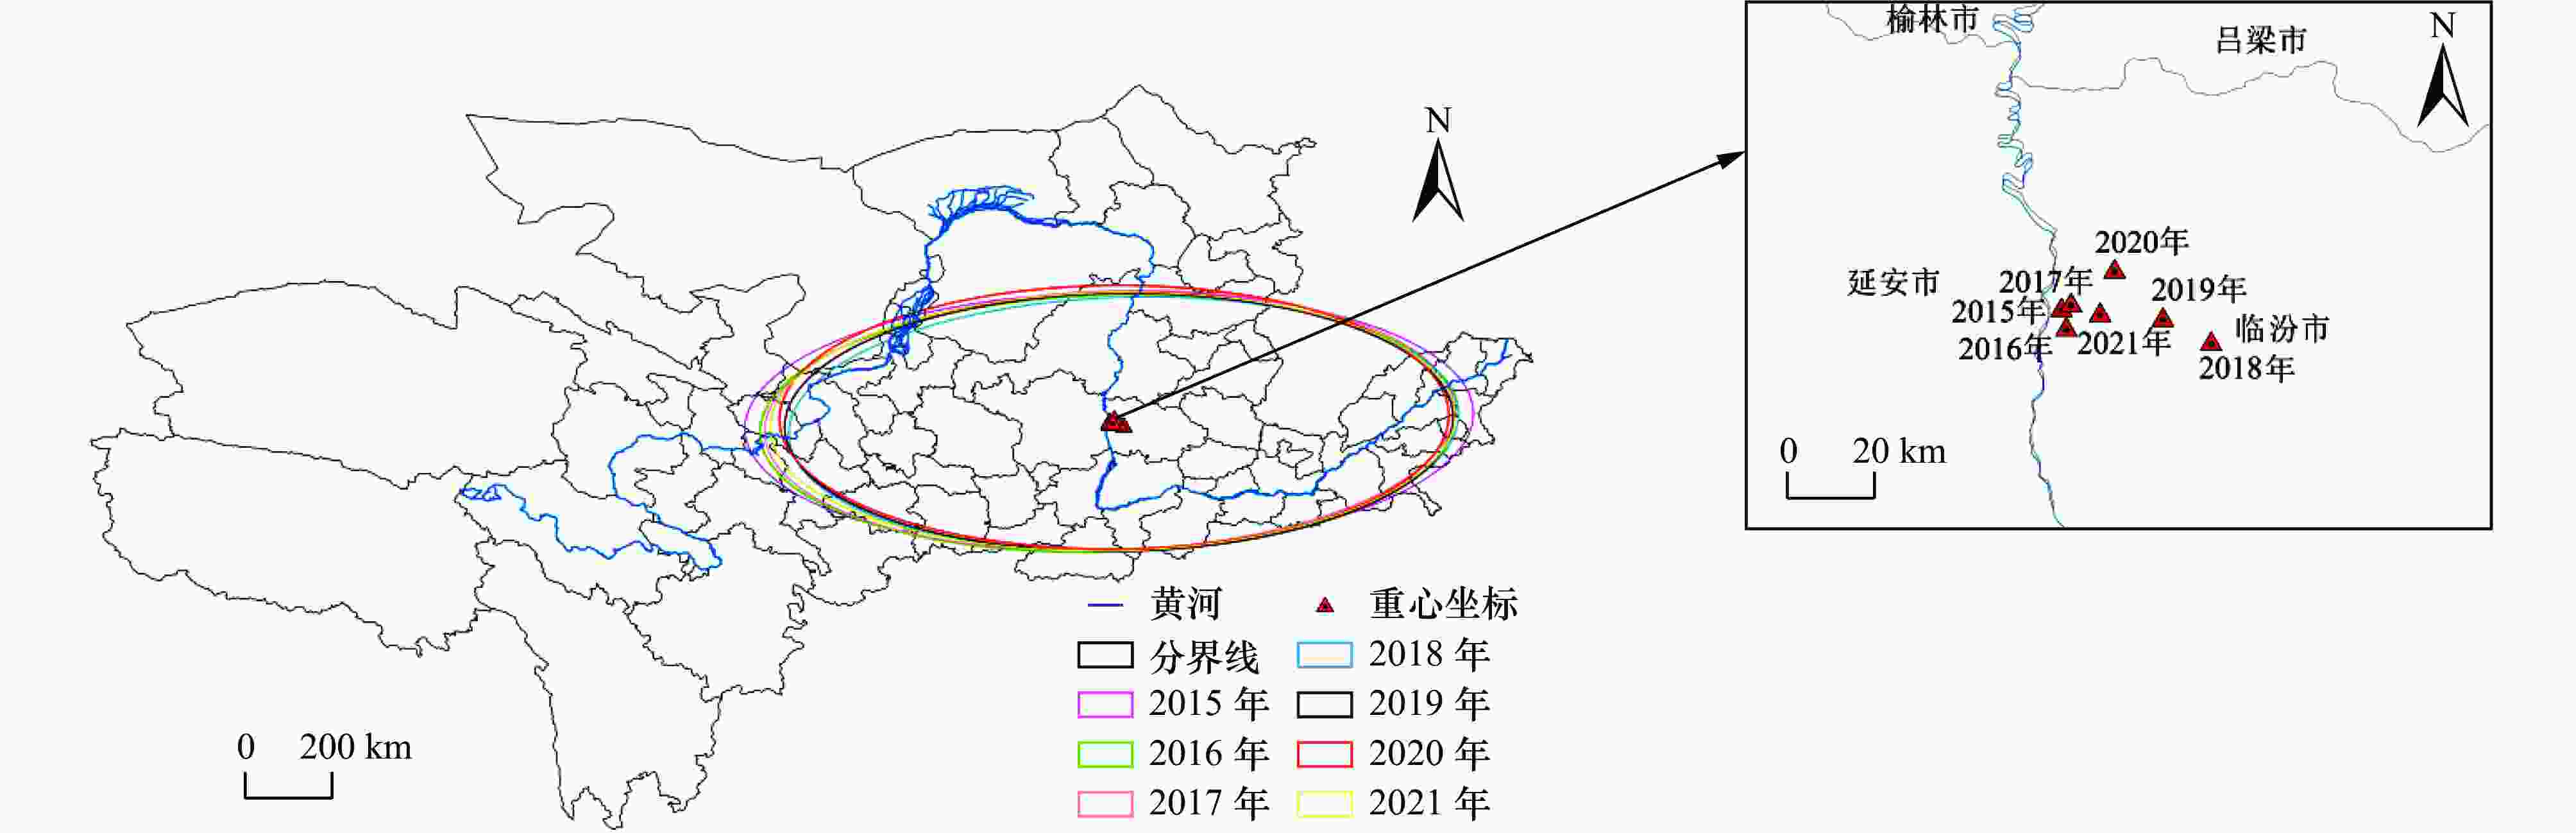
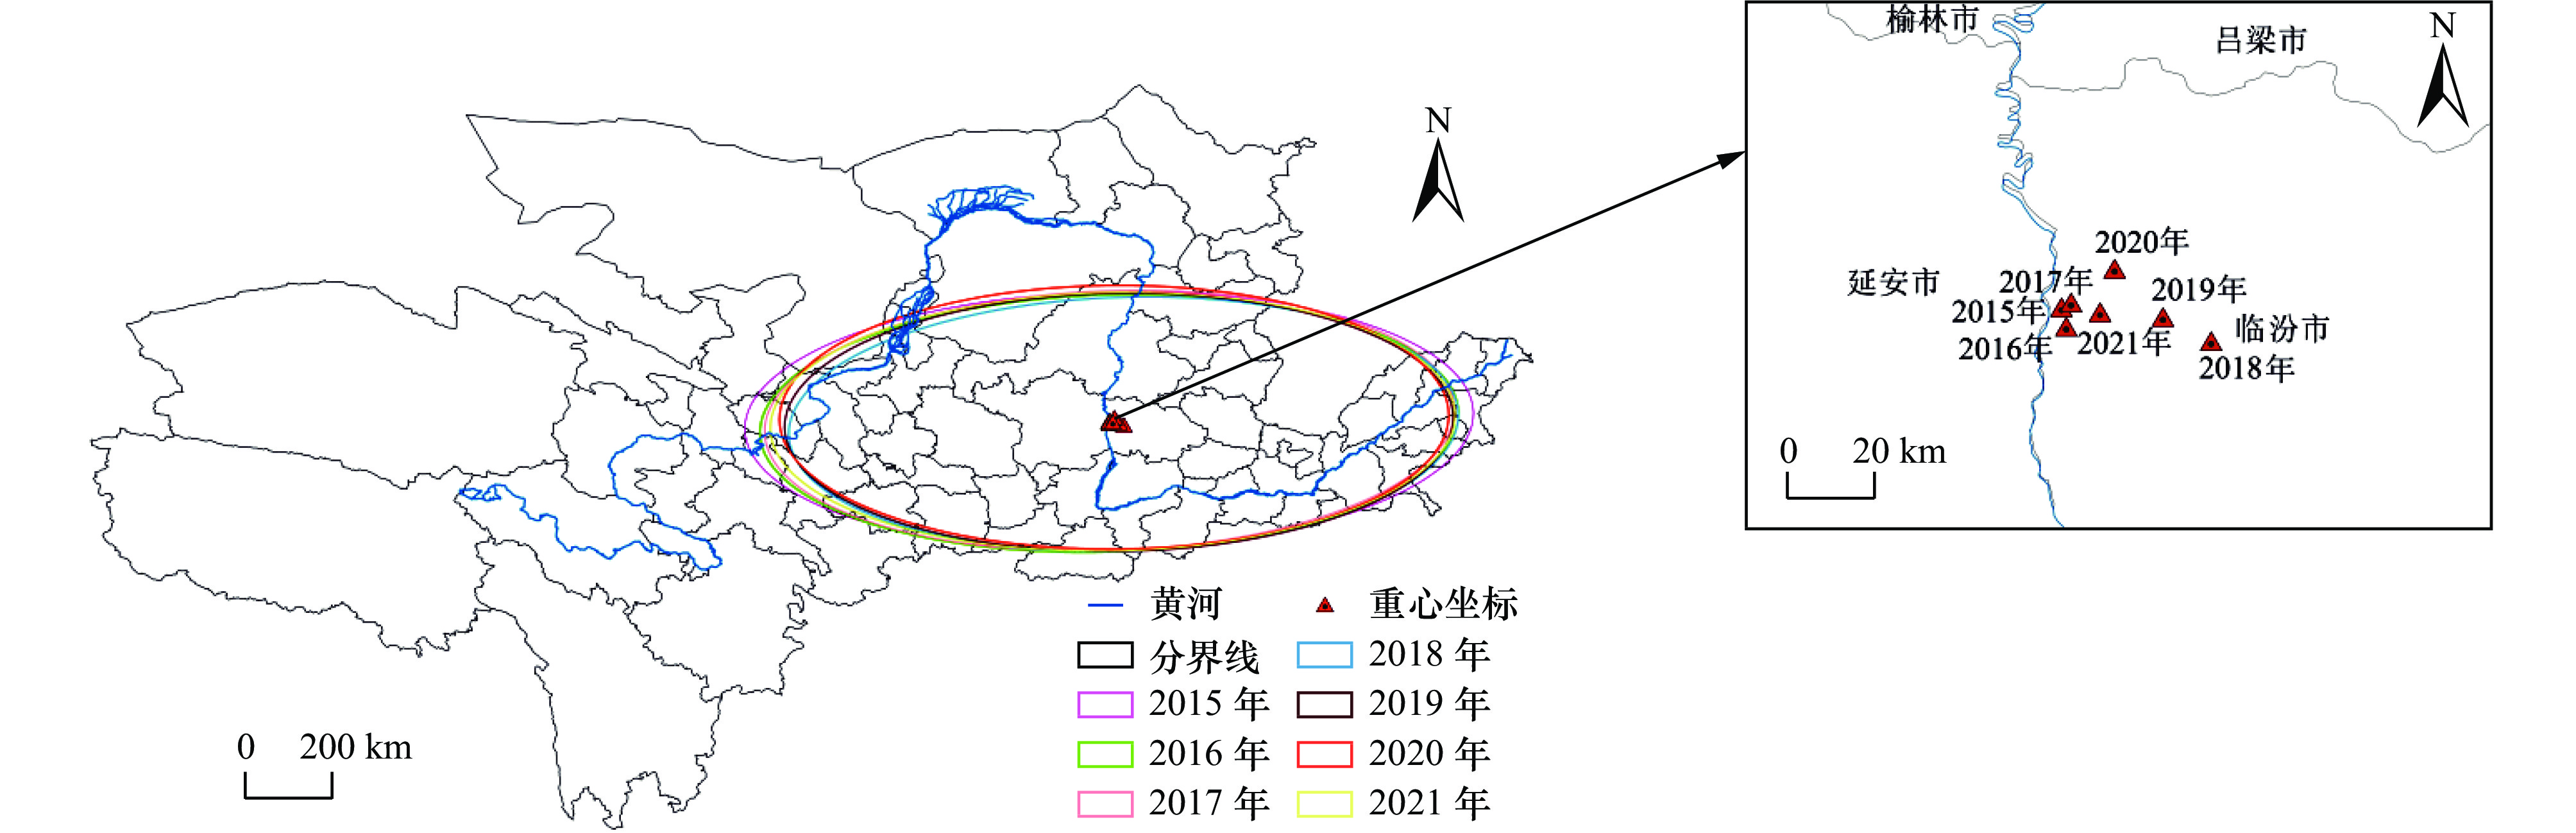
图 8 2015—2021年黄河流域城市PM2.5浓度时空演变格局
Figure 8. Spatial and temporal patterns of PM2.5 concentration in cities of the Yellow River Basin from 2015 to 2021
表 1 黄河流域省份城市区域划分
Table 1. Division of provinces and cities in the Yellow River Basin
流域划分 省份 地级市(或自治州) 上游(25个) 青海省(8个) 玉树藏族自治州、果洛藏族自治州、海北藏族自治州、黄南藏族自治州、西宁市、海东市、海西蒙古
族藏族自治州、海南藏族自治州甘肃省(6个) 甘南藏族自治州、临夏回族自治州、武威市、兰州市、定西市、白银市 四川省(2个) 阿坝藏族羌族自治州、甘孜藏族自治州 宁夏回族自治区(5个) 石嘴山市、固原市、吴忠市、中卫市、银川市 内蒙古自治区(4个) 乌海市、包头市、阿拉善盟、巴彦淖尔市 中游(30个) 甘肃省(4个) 庆阳市、平凉市、陇南市、天水市 内蒙古自治区(3个) 鄂尔多斯市、呼和浩特市、乌兰察布市 陕西省(8个) 榆林市、铜川市、渭南市、延安市、咸阳市、西安市、宝鸡市、商洛市 山西省(11个) 朔州市、忻州市、太原市、长治市、晋城市、阳泉市、晋中市、吕梁市、临汾市、运城市、大同市 河南省(4个) 济源市、焦作市、洛阳市、三门峡市 下游(15个) 河南省(6个) 濮阳市、鹤壁市、安阳市、郑州市、开封市、新乡市 山东省(9个) 菏泽市、济宁市、聊城市、泰安市、德州市、济南市、淄博市、滨州、东营市  下载: 导出CSV
表 2 2015—2021年黄河流域城市PM2.5全局Moran′s I
Table 2. Global spatial Moran index of PM2.5 in the Yellow River Basin from 2015 to 2021
年份 Moran′s I值 Z值 P值 2015 0.798 10.614 4 0.001 2016 0.760 10.331 5 0.001 2017 0.727 9.827 9 0.001 2018 0.820 11.137 9 0.001 2019 0.793 10.800 5 0.001 2020 0.746 10.018 1 0.001 2021 0.734 9.804 4 0.001
下载: 导出CSV
表 3 2015—2021年黄河流域城市PM2.5浓度空间聚集城市统计
Table 3. Statistics of PM2.5 spatial concentration in cities of the Yellow River Basin from 2015 to 2021
个 年份 上游 中游 下游 总计 “高—高”集聚 “低—低”集聚 “高—高”集聚 “低—低”集聚 “高—高”集聚 “低—低”集聚 “高—高”集聚 “低—低”集聚 2015 0 18 7 5 15 0 22 23 2016 0 22 10 2 15 0 25 24 2017 0 22 13 2 15 0 28 24 2018 0 24 12 3 15 0 27 27 2019 0 21 11 2 15 0 26 23 2020 0 17 11 2 15 0 26 19 2021 0 19 11 3 15 0 26 22
下载: 导出CSV
表 4 黄河流域城市PM2.5浓度的标准差椭圆参数
Table 4. Standard deviation elliptic parameters of PM2.5 concentration in cities of the Yellow River Basin
年份 方位角/(°) 重心坐标 重心所在地区 椭圆面积/km2 长轴标准差/km 短轴标准差/km 长短轴差值/km 2015 88.64 110.51°E、36.42°N 临汾市 637229.85 756.08 268.32 487.76 2016 88.22 110.52°E、36.38°N 临汾市 606788.41 725.15 266.49 458.66 2017 87.95 110.53°E、36.43°N 临汾市 606141.32 716.21 269.43 446.78 2018 88.16 110.82°E、36.35°N 临汾市 575232.88 695.06 263.47 431.59 2019 89.09 110.72°E、36.40°N 临汾市 582801.08 693.71 267.46 426.25 2020 89.60 110.62°E、36.50°N 临汾市 595855.86 694.44 273.16 421.28 2021 88.76 110.59°E、36.41°N 临汾市 597499.40 710.41 267.76 442.65
下载: 导出CSV
表 5 黄河流域城市不同季节的PM2.5浓度与其他空气污染物的Pearson相关系数
Table 5. Seasonal variation of Pearson correlation coefficients between PM2.5 and gaseous pollutants in the cities of the Yellow River Basin
项目 PM10浓度 NO2浓度 SO2浓度 CO浓度 O3浓度 上游城市PM2.5浓度 春季 0.428* 0.589** −0.009 0.243 0.161 夏季 0.826** 0.520** 0.331 0.449* 0.661** 秋季 0.871** 0.763** 0.346 0.630** 0.102 冬季 0.923** 0.835** 0.421* 0.024 −0.382 年均值 0.950** 0.772** 0.570** 0.758** 0.338 中游城市PM2.5浓度 春季 0.686** 0.364* 0.111 0.690** 0.546** 夏季 0.791** 0.278 0.125 0.879** 0.867** 秋季 0.767** 0.429* −0.110 0.705** 0.427* 冬季 0.878** 0.589** −0.156 −0.182 −0.425* 年均值 0.950** 0.662** 0.295 0.639** 0.243 下游城市PM2.5浓度 春季 0.015 −0.034 −0.273 0.190 −0.408 夏季 0.444 0.572* 0.151 0.382 0.262 秋季 0.861** 0.327 −0.219 0.535* −0.521* 冬季 0.614* −0.290 −0.373 −0.079 0.222 年均值 0.825** 0.265 −0.097 0.607* −0.271 注:**表示在0.01(双侧)水平上显著相关;*表示在0.05(双侧)水平上显著相关.
下载: 导出CSV
-
[1] LIU Q,WANG S,ZHANG W,et al.Examining the effects of income inequality on CO2 emissions:evidence from nonspatial and spatial perspectives[J].Applied Energy,2019,23(6):163-171. [2] 张涵,姜华,高健,等.PM2.5与臭氧污染形成机制及协同防控思路[J].环境科学研究,2022,39(4):611-620.ZHANG H,JIANG H,GAO J,et al.Formation mechanism and management strategy of cooperative control of PM2.5 and O3[J].Research of Environmental Sciences,2022,39(4):611-620. [3] 赵文斐,于占江,王让会,等.石家庄市PM2.5时空特征及其对土地利用变化的响应[J].生态环境学报,2020,29(12):2404-2413.ZHAO W P,YU Z J,WANG R H,et al.Spatial and temporal characteristics of PM2.5 and its response to land use change in Shijiazhuang[J].Ecology and Environmental Sciences,2020,29(12):2404-2413. [4] CAI W J,LI K,LIAO H,et al.Weather conditions conduciveto Beijing severe haze more frequent under climate change[J].Nature Climate Change,2017,7(4):257-262. doi: 10.1038/nclimate3249 [5] WU S W,DENG F R,WEI H Y,et al.Association of cardiopulmonary health effects with source-appointed ambient fine particulate in Beijing,China:a combined analysis from the healthy volunteer natural relocation study[J].Environmental Science & Technology,2014,48(6):3438-3448. [6] 胡剑波,王楷文.中国省域碳排放效率时空差异及空间收敛性研究[J].管理学刊,2022,35(4):36-52.HU J B,WANG K W.Study on temporal and spatial differences and spatial convergence of provincial carbon emission efficiency in China[J].Journal of Management,2022,35(4):36-52. [7] 章志龙,施蕾蕾,曹飞,等.对甘南高原黄河流域生态环境保护与高质量发展的思考[J].环境保护,2022,50(15):62-65.ZHANG Z L,SHI L L,CAO F,et al.Thoughts on sustainable and high-quality development of ecological environment protection of Yellow River Basin in Gannan Plateau[J].Environmental Protection,2022,50(15):62-65. [8] 李衡,韩燕.黄河流域PM2.5时空演变特征及其影响因素分析[J].世界地理研究,2022,31(1):130-141. doi: 10.3969/j.issn.1004-9479.2022.01.2020212LI H,HAN Y.Analysis on the spatial-temporal evolution characteristics of PM2.5 and its influencing factors in the Yellow River Basin[J].World Regional Studies,2022,31(1):130-141. doi: 10.3969/j.issn.1004-9479.2022.01.2020212 [9] 李子璇,杨兆莉,常莉敏,等.基于SPAMS的兰州市PM2.5来源季节性差异[J].兰州大学学报(自然科学版),2021,57(6):711-719.LI Z X,YANG Z L,CHANG L M,et al.Seasonal variations of sources for PM2.5 based on SPAMS in Lanzhou City[J].Journal of Lanzhou University (Natural Sciences),2021,57(6):711-719. [10] 钱骏,冯小琼,陈军辉,等.四川盆地典型城市PM2.5污染过程组分特征和来源解析[J].环境科学学报,2021,41(11):4366-4376.QIAN J,FENG X Q,CHEN J H,et al.Composition characteristics and source apportionment of PM2.5 pollution process in typical cities in the Sichuan Basin[J].Acta Scientiae Circumstantiae,2021,41(11):4366-4376. [11] 郭振东,朱彬,王红磊,等.长江三角洲霾天气PM2.5中水溶性离子特征及来源解析[J].中国环境科学,2019,39(3):928-938. doi: 10.3969/j.issn.1000-6923.2019.03.004GUN Z D,ZHU B,WANG H L,et al.Characteristics and source analysis of water-soluble ions in PM2.5 in the haze weather over in Yangtze River Delta[J].China Environmental Science,2019,39(3):928-938. doi: 10.3969/j.issn.1000-6923.2019.03.004 [12] 刘小真,任羽峰,刘忠马,等.南昌市大气颗粒物污染特征及PM2.5来源解析[J].环境科学研究,2019,32(9):1546-1555.LIAO X Z,REN Y F,LIU Z M,et al.Pollution characteristics of atmospheric particles and source apportionment of PM2.5 in Nanchang City[J].Research of Environmental Sciences,2019,32(9):1546-1555. [13] 揣小伟,高润艺,李建豹,等.中国PM2.5排放浓度时空变化及区域公平性分析[J].长江流域资源与环境,2021,30(11):2693-2702.CHUAI X W,GAO R Y,LI J B,et al.Temporal-spatial changes of PM2.5 emissions and concentrations across China and regional inequity analysis[J].Resources and Environment in the Yangtze Basin,2021,30(11):2693-2702. [14] 任毅,郭丰,高聪聪.京津冀城市群雾霾污染的时空特征与影响因素[J].首都经济贸易大学学报,2019,21(6):80-91.REN Y,GUO F,GAO C C.Spatial-temporal characteristics of haze pollution and its influencing factors in Beijing-Tianjin-Hebei urban agglomeration[J].Journal of Capital University of Economics and Business,2019,21(6):80-91. [15] 葛岂序,刘岩,杨洪,等.2015—2019年河南省PM2.5时空特征与驱动因素分析[J].环境科学,2022,43(4):1697-1705.GE Q X,LIU Y,YANG H,et al.Analysis on spatial-temporal characteristics and driving factors of PM2.5 in Henan province from 2015 to 2019[J].Environmental Science,2022,43(4):1697-1705. [16] 王梦迪,吉文丽,李凯媛.西安市PM10、PM2.5的时空特征及其与土地利用的关系[J].西北林学院学报,2021,36(4):249-256.WANG M D,JI W L,LI K Y.Spatial and temporal distributions of PM10 and PM2.5 in Xi'an and their relationships with land use pattern[J].Journal of Northwest Forestry University,2021,36(4):249-256. [17] 耿佳辰,沈石,程昌秀.“十三五”时期黄河流域PM2.5时空分布规律及多尺度社会经济影响机制分析[J].地球信息科学学报,2022,24(6):1163-1175.GENG J C,SHEN S,CHENG C X.Spatio-temporal evolution and multi-scale socio-economic influencing mechanism of PM2.5 in the Yellow River Basin during the China's ‘13th Five-Year Plan’[J].Journal of Geo-information Science,2022,24(6):1163-1175. [18] 滕堂伟,谌丹华,胡森林.黄河流域空气污染的空间格局演化及影响因素[J].地理科学,2021,41(10):1852-1861.TENG T W,ZHEN D H,HU S L.Spatial evolution and influencing factors of spatial agglomeration pattern of air pollution in the Yellow River Basin[J].Scientia Geographica Sinica,2021,41(10):1852-1861. [19] GAO X R,ZHAO Q,ZHAO X N,et al.Temporal and spatial evolution of the standardized precipitation evapotranspiration index (SPEI) in the Loess Plateau under climate change from 2001 to 2050[J].Science of the Total Environment,2017,595(1):191-200. [20] ZHAO X J,ZHANG X L,XU X F,et al.Seasonal and diurnal variations of ambient PM2.5 concentration in urban and rural environments in Beijing[J].Atmospheric Environment,2009,43(18):2893-2900. doi: 10.1016/j.atmosenv.2009.03.009 [21] 赵安周,相恺政,刘宪锋,等.2000—2018年京津冀城市群PM2.5时空演变及其与城市扩张的关联[J].环境科学,2022,43(5):2274-2283.ZHAO A Z,XIANG K Z,LIU X F,et al.Spatio-temporal evolution patterns of PM2.5 and relationship with urban expansion in Beijing-Tianjin-Hebei urban agglomeration from 2000 to 2018[J].Environmental Science,2022,43(5):2274-2283. [22] LIU J K,YAN G X,WU Y N,et al.Wetlands with greater degree of urbanization improve PM2.5 removal efficiency[J].Chemosphere,2018,207(9):601-611. [23] 夏晓圣,汪军红,宋伟东,等.2000—2019年中国PM2.5时空演化特征[J].环境科学,2021,41(11):4832-4843.XIA X S,WANG J H,SONG W D,et al.Spatio-temporal evolution of PM2.5 concentration during 2000-2019 in China[J].Environmental Science,2021,41(11):4832-4843. [24] 李杨,刘永和,王西岳,等.焦作市PM2.5和PM10时空变化特征及其与气象因子的关系[J].环境工程,2022,40(9):44-53.LI Y,LIU Y H,WANG X Y,et al.The Spatial-temporal characteristics of PM2.5 and PM10 and their relationships with meteorological factors in Jiaozuo[J].Environmental Engineering,2022,40(9):44-53. [25] 周志凌,程先富.基于MGWR模型的中国城市PM2.5影响因素空间异质性[J].中国环境科学,2021,41(6):2552-2561.ZHOU Z L,CHENG X F.Spatial heterogeneity of influencing factors of PM2.5 in Chinese cities based on MGWR model[J].China Environmental Science,2021,41(6):2552-2561. [26] 王丽丽,刘笑杰,李丁,等.长江经济带PM2.5空间异质性和驱动因素的地理探测[J].环境科学,2022,43(3):1190-1200.WANG L L,LIU X J,LI D,et al.Geographical detection of spatial heterogeneity and drivers of PM2.5 in the Yangtze River Economic Belt[J].Environmental Science,2022,43(3):1190-1200. [27] 黄小刚,邵天杰,赵景波,等.汾渭平原PM2.5浓度的影响因素及空间溢出效应[J].中国环境科学,2019,39(8):3539-3548.HUANG X G,SHAO T J,ZHAO J B,et al.Influence factors and spillover effect of PM2.5 concentration on Fen-Wei Plain[J].China Environmental Science,2019,39(8):3539-3548. [28] 杨慧芳,张合林.黄河流域生态保护与经济高质量发展耦合协调关系评价[J].统计与决策,2022,38(11):114-119.YANG H F,ZHANG H L.Evaluation of ecological protection and high-quality economic development coupling coordination relationship in the Yellow River Basin[J].Statistics & Decision,2022,38(11):114-119. [29] 程昌秀,沈石,李强坤.黄河流域人地系统研究的大数据支撑与方法探索[J].中国科学基金,2021,35(4):529-536.CHENG C X,SHEN S,LI Q K.Big data support and method exploration about natural and human systems research in the Yellow River Basin[J].Bulletin of National Natural Science Foundation of China,2021,35(4):529-536. [30] 黄小刚,赵景波,曹军骥,等.长江经济带PM2.5分布格局演变及其影响因素[J].环境科学,2021,41(3):1013-1024.HUANG X G,ZHAO J B,CAO J J,et al.Evolution of the distribution of PM2.5 concentration in the Yangtze River Economic Belt and its influencing factors[J].Environmental Science,2021,41(3):1013-1024. [31] 丁俊菘,邓宇洋,马良.黄河流域雾霾污染时空特征及其影响因素[J].统计与决策,2022,38(6):60-64.DING J S,DENG Y Y,MA L.Spatial-temporal characteristics and its influencing factors of haze pollution in the Yellow River Basin[J].Statistics & Decision,2022,38(6):60-64. [32] 周晓艳,郝慧迪,叶信岳,等.黄河流域区域经济差异的时空动态分析[J].人文地理,2016,31(5):119-125. doi: 10.13959/j.issn.1003-2398.2016.05.018ZHOU X Y,HAO H D,YE X Y,et al.A spatial-temporal analysis of regional economic inequality in Yellow River Valley[J].Human Geography,2016,31(5):119-125. doi: 10.13959/j.issn.1003-2398.2016.05.018 [33] 杨晓辉,肖登攀,柏会子,等.2013—2020年京津冀地区PM2.5浓度时空变化模拟及趋势分析[J].地理与地理信息科学,2022,38(4):58-67.YANG X H,XIAO D P,BAI H Z,et al.Simulation and trend analysis of spatiotemporal variation of PM2.5 concentrations in the Beijing-Tianjin-Hebei Region from 2013 to 2020[J].Geography and Geo-Information Science,2022,38(4):58-67. [34] 孙智君,张雅晴.中国高技术制造业集聚水平的时空演变特征—基于空间统计标准差椭圆方法的实证研究[J].科技进步与对策,2018,35(9):54-58.SUN Z J,ZHANG Y Q.The spatio-temporal evolution features of high-tech manufacturing industry's agglomeration level in China[J].Science & Technology Progress and Policy,2018,35(9):54-58. [35] ZHANG Y K,LI Y L,SONG J Z,et al.Pearson correlation coefficient of current derivatives based pilot protection scheme for long-distance LCC-HVDC transmission lines[J].International Journal of Electrical Power and Energy Systems,2020,116(3):1367-1371. [36] 庞军,吴健,马中,等.我国城市天然气替代燃煤集中供暖的大气污染减排效果[J].中国环境科学,2015,35(1):55-61.PANG J,WU J,MA Z,et al.Air pollution abatement effects of replacing coal with natural gas for central heating in cities of China[J].China Environmental Science,2015,35(1):55-61. [37] 刘昕,辛存林.陕甘宁地区城市空气质量特征及影响因素分析[J].环境科学研究,2019,32(12):2065-2074.LIU X,XIN C L.Analysis of urban air quality characteristics and influencing factors in Shaanxi Gansu-Ningxia Region[J].Research of Environmental Sciences,2019,32(12):2065-2074. [38] XIE Y Y,ZHAO B,ZHANG L,et al.Spatiotemporal variations of PM2.5 and PM10 concentrations between 31 Chinese cities and their relationships with SO2,NO2,CO and O3[J].Particuology,2015,20(3):141-149. [39] WANG Y,YING Q,HU J,et al.Spatial and temporal variations of six criteria air pollutants in 31 provincial capital cities in China during 2013-2014[J].Environment International,2014,73(1):413-422. [40] 罗悦函,赵天良,孟凯,等.华北平原和山区城市PM2.5和O3变化关系比较分析[J].中国环境科学,2021,41(9):3981-3989.LUO H Y,ZHAO T L,MENG K,et al.Comparative analysis of the relationship between PM2.5 and O3 in plain and mountainous cities in North China[J].China Environmental Science,2021,41(9):3981-3989. -


 点击查看大图
计量
- 文章访问数: 414
- HTML全文浏览量: 97
- PDF下载量: 170
- 被引次数: 0
