


Temporal and Spatial Effects of Carbon Emissions in the Yangtze River Delta from the Perspective of Environmental Regulation
-
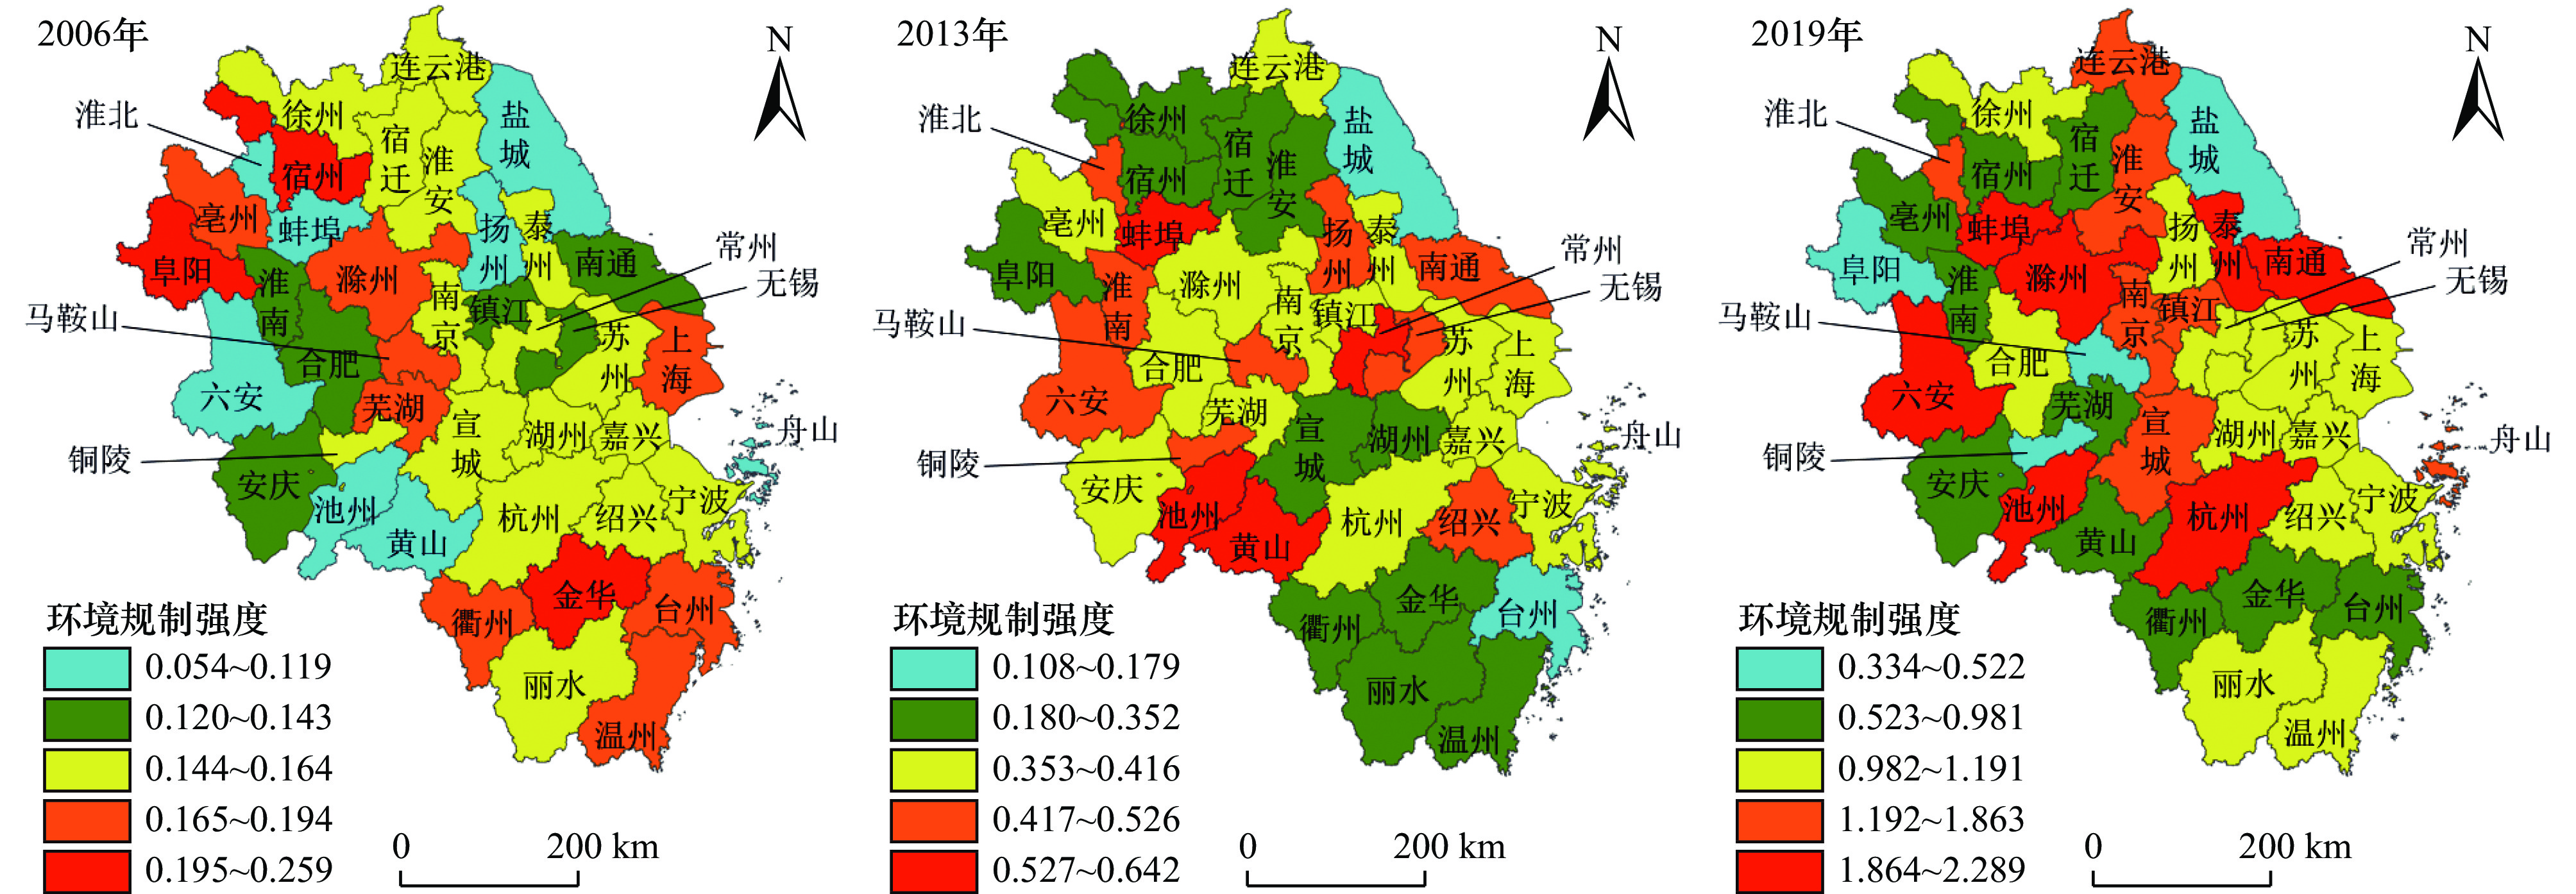
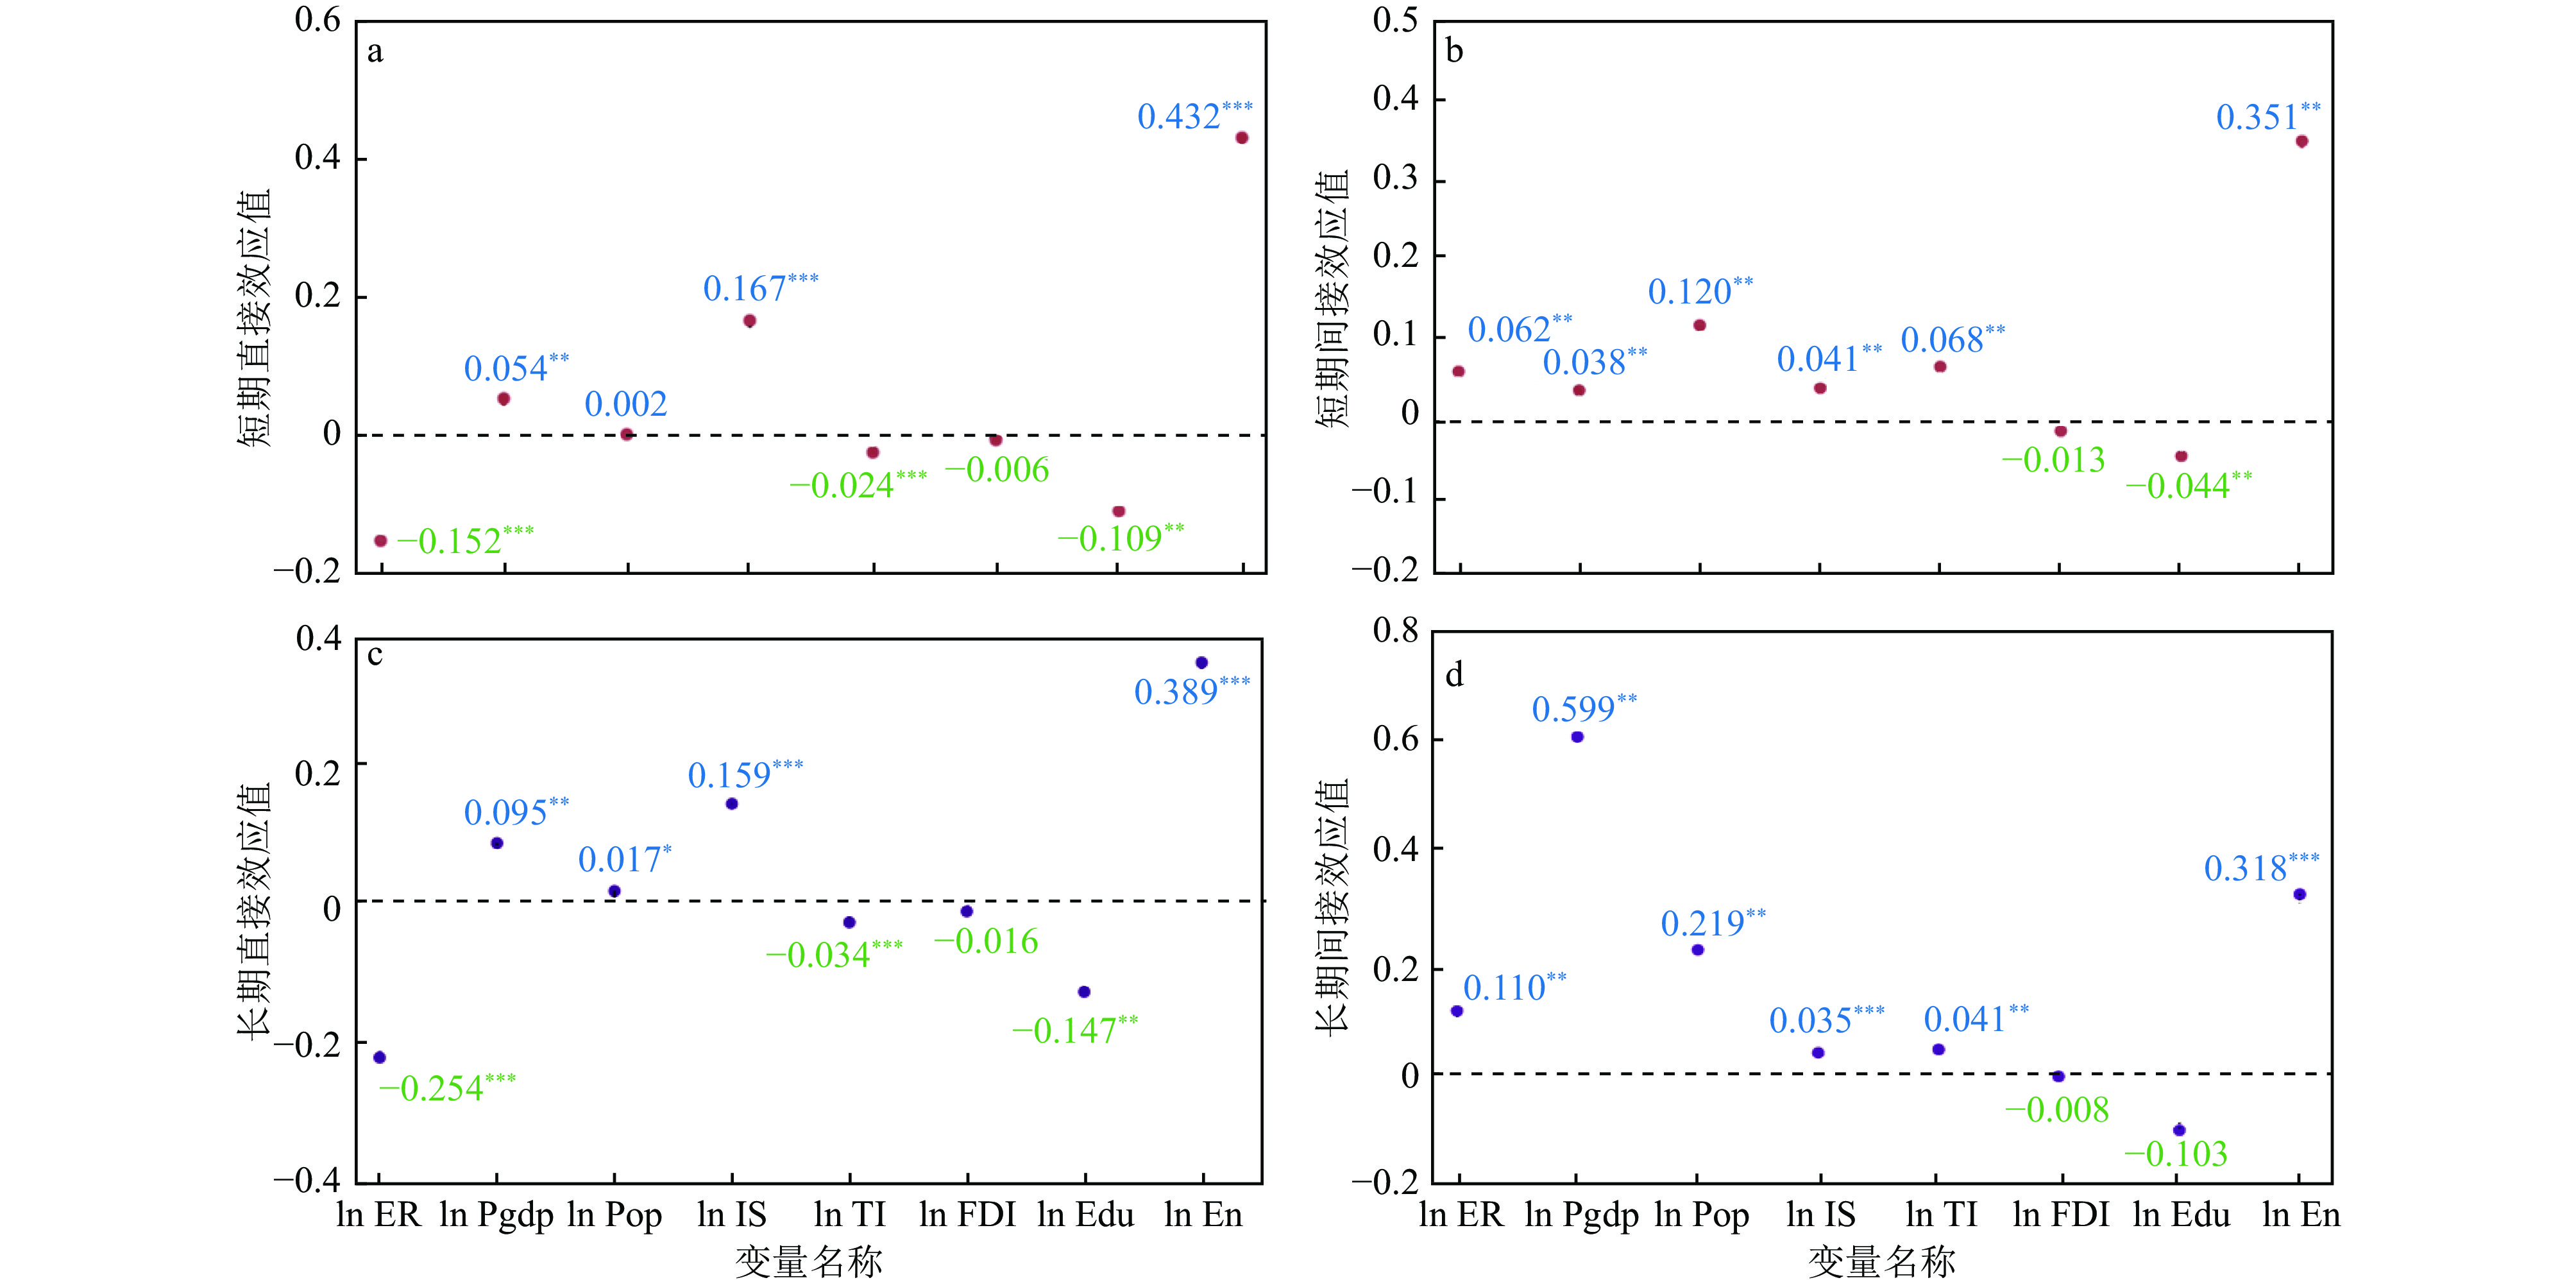
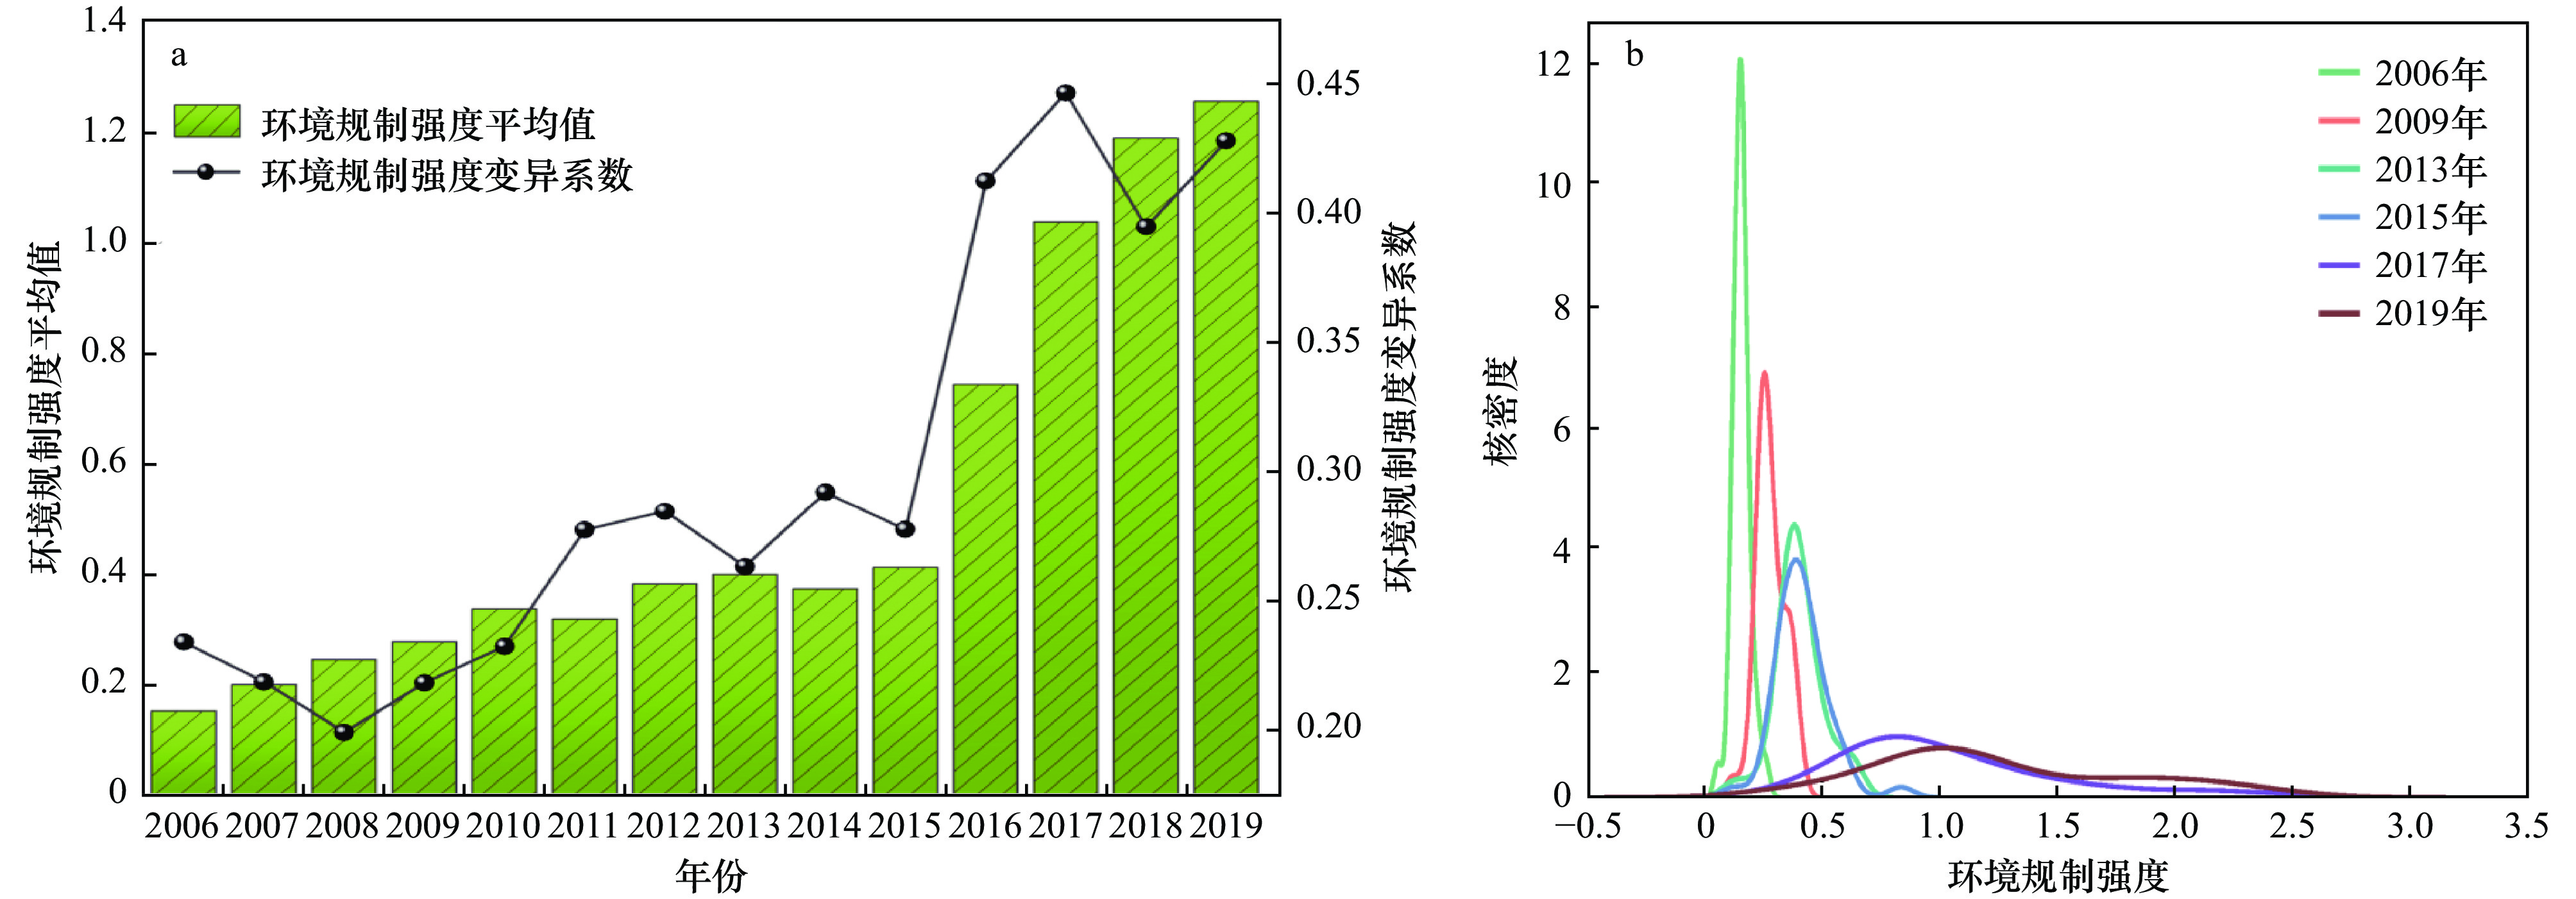
摘要: 在“双碳”目标背景下,环境规制与CO2排放的关系逐渐成为学界热点. 本文基于长三角地区41城市的面板数据,利用CO2排放系数法、环境规制强度综合指数对长三角41城市2006—2019年的CO2排放、环境规制强度进行定量测度,通过核密度分析、GIS空间分析等方法揭示长三角地区41城市环境规制强度和CO2排放水平的时空格局,并运用动态空间杜宾模型(DSDM)探讨环境规制对CO2排放的时空影响效应. 结果表明:①长三角地区环境规制强度指数呈增强态势,由2006年的0.15升至2019年的1.25. 核密度曲线显示,环境规制强度存在空间极化现象,在空间上呈现由东南向西北转移的演变态势. ②2006—2019年长三角地区CO2排放水平整体呈波动上升趋势,2006—2013年CO2排放增幅为65.07%,2013—2019年增幅仅为4.20%. CO2排放在空间上总体呈东高西低的分布格局,2006年在沪苏地区形成CO2排放高值集聚区,随后空间范围扩大并向西北方向蔓延,2013—2019年呈中心城市向外围扩散的格局. ③从短期效应看,环境规制强度每提升1%,将抑制本城市0.152%的CO2排放量,但促进邻近城市0.062%的CO2排放量;从长期效应看,环境规制强度每提升1%,将抑制本城市0.254%的CO2排放量,并促进邻近城市0.110%的CO2排放量,即环境规制的长期效应大于短期效应. ④长三角各城市要充分考虑自身特质,制定合理的环境规制和差异化的低碳减排策略,以提高资源环境承载力,实现人地关系的协调发展. 研究显示,长三角地区CO2排放的增速整体变缓,环境规制强度的提高对CO2排放的影响存在空间异质性.
-
关键词:
- 环境规制 /
- CO2排放 /
- 时空效应 /
- 动态空间杜宾模型(DSDM)
Abstract: In the context of the ‘double carbon target’, the relationship between environmental regulation and carbon dioxide emissions has become an increasingly popular topic of discussion in the academic circles. Based on the panel data of 41 cities in the Yangtze River Delta Region, this paper demonstrated the carbon dioxide emissions and environmental regulation intensity of 41 cities in the Yangtze River Delta Region from 2006 to 2019 using kernel density analysis and GIS spatial analysis. The carbon dioxide emission coefficient method and the environmental regulation intensity composite index were used to show the spatial and temporal patterns of environmental regulation intensity and carbon dioxide emissions levels in 41 cities in the Yangtze River Delta Region. The spatial and temporal effects of environmental regulation on carbon dioxide emissions were investigated using the Dynamic Spatial Durbin Model (DSDM). The results show: (1) There was an increase in the Yangtze River Delta Region's environmental regulation intensity index from 0.15 in 2006 to 1.25 in 2019. The kernel density curve showed that there was a spatial polarization in environmental regulation intensity, with a shift in the direction of the index from the southeast to the northwest. (2) From 2006 and 2019, the total carbon dioxide emissions in the Yangtze River Delta Region fluctuated, increasing by 65.07% from 2006 to 2013, and only 4.20% from 2013 to 2019. Carbon dioxide emissions showed a spatial distribution pattern of high in the east and low in the west, forming a high-value concentration area of carbon dioxide emissions in the Shanghai-Suzhou region in 2006, and then expanding spatially and spreading to the northwest, showing a pattern of diffusion from the central cities to the surrounding area from 2013 to 2019. (3) In terms of short-term consequences, each 1% increase in the intensity of environmental regulation decreased carbon dioxide emissions by 0.152% in the city, while the carbon dioxide emissions increased by 0.062% in nearby cities. In terms of long-term consequences, each 1% increase in the intensity of environmental regulations reduced carbon dioxide emissions by 0.254% in the city, and increased the carbon dioxide emissions in nearby cities by 0.110%. Therefore, the long-term effects of environmental regulations are stronger than their short-term effects. (4) Each city in the Yangtze River Delta should consider its own features and adopt acceptable environmental regulations and various low-carbon dioxide emission reduction strategies in order to increase the carrying capacity of resources and the environment and achieve a harmonious development of the relationship between people and land. The study showed that the overall growth rate of carbon dioxide emissions in the Yangtze River Delta slowed down, and the impact of environmental regulation intensity on carbon dioxide emissions was spatially heterogeneous. -

图 1 长三角地区环境规制强度的时序演化
Figure 1. Changes in environmental regulation intensity throughout time in the Yangtze River Delta
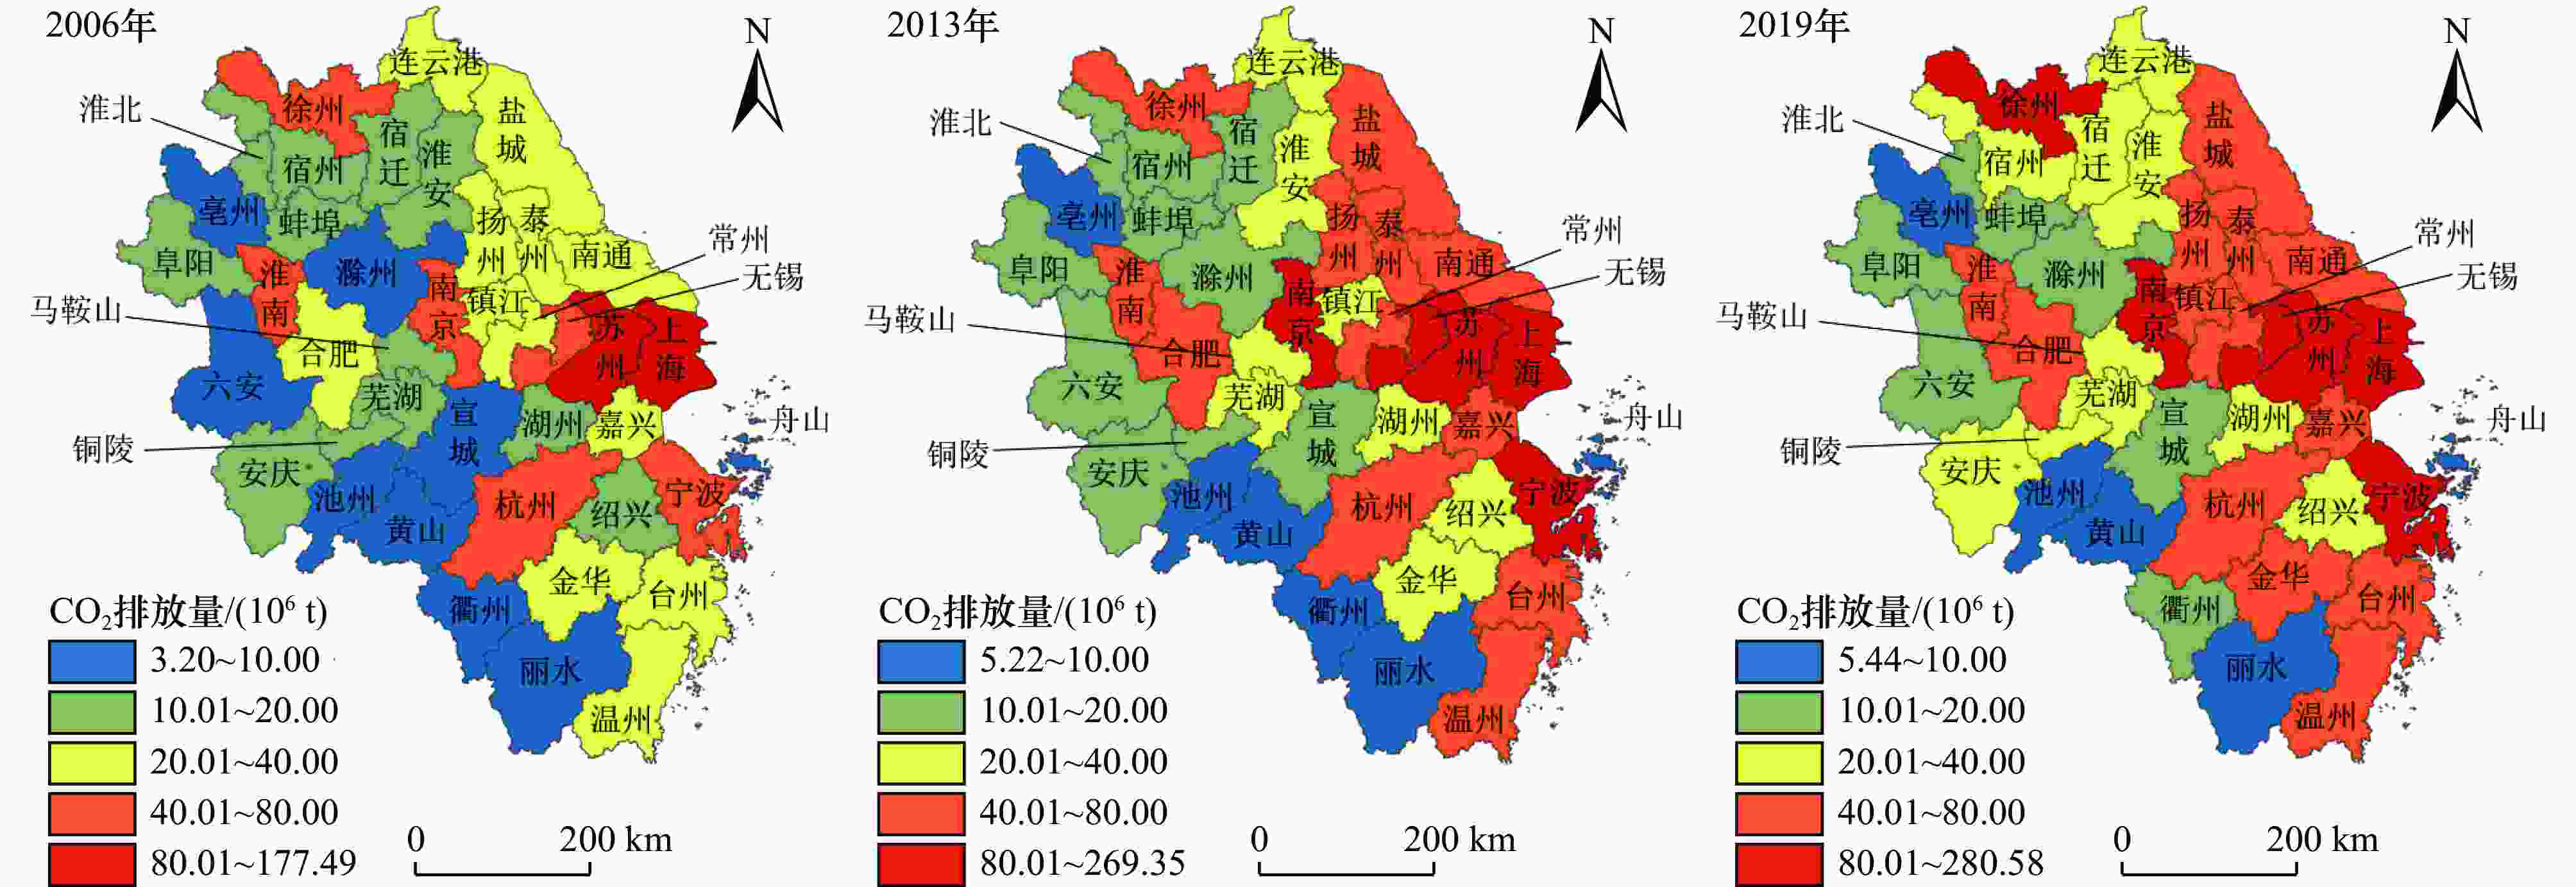
图 2 长三角地区CO2排放量的空间格局
Figure 2. Carbon dioxide emissions spatial distribution in the Yangtze River Delta
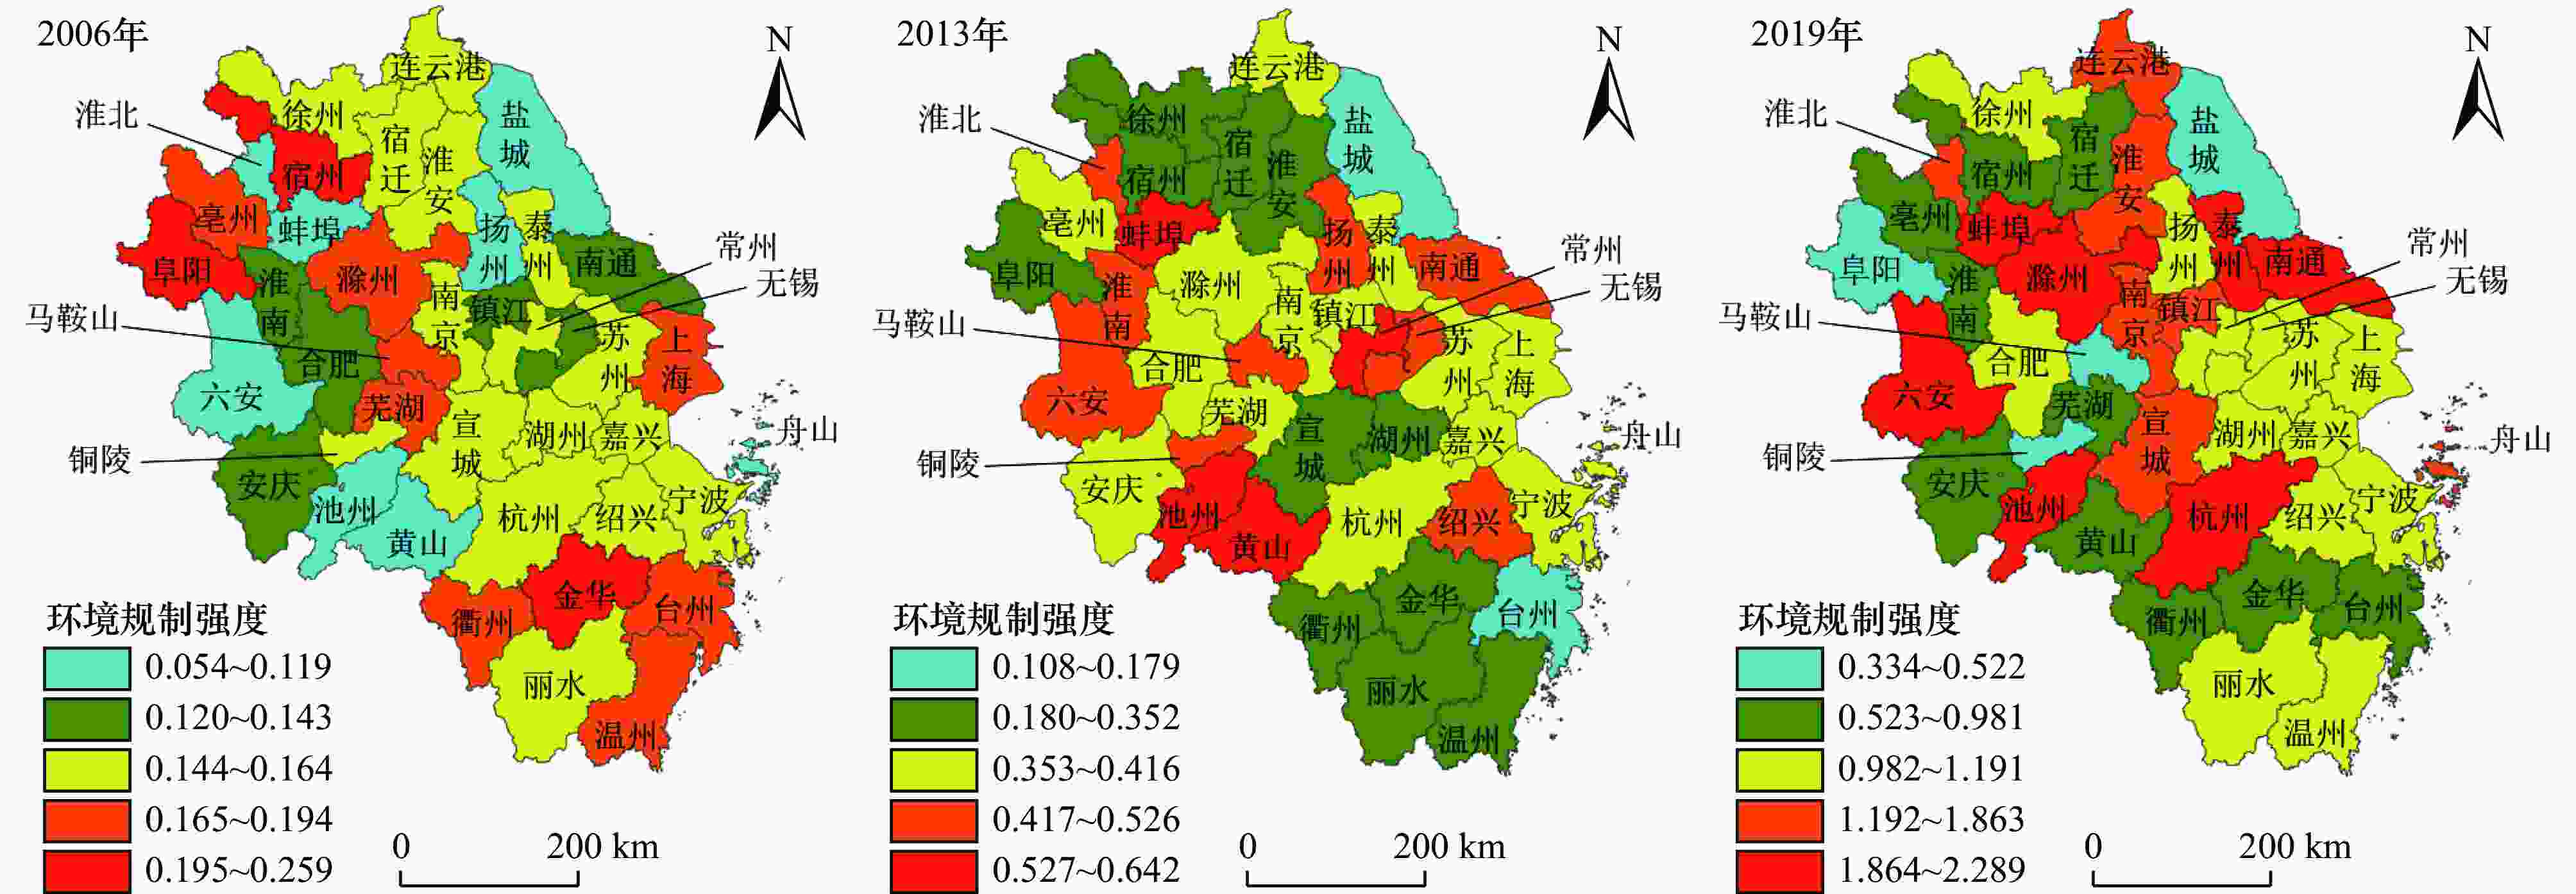
图 3 长三角地区环境规制强度的空间格局
Figure 3. Spatial pattern of environmental regulation intensity in the Yangtze River Delta
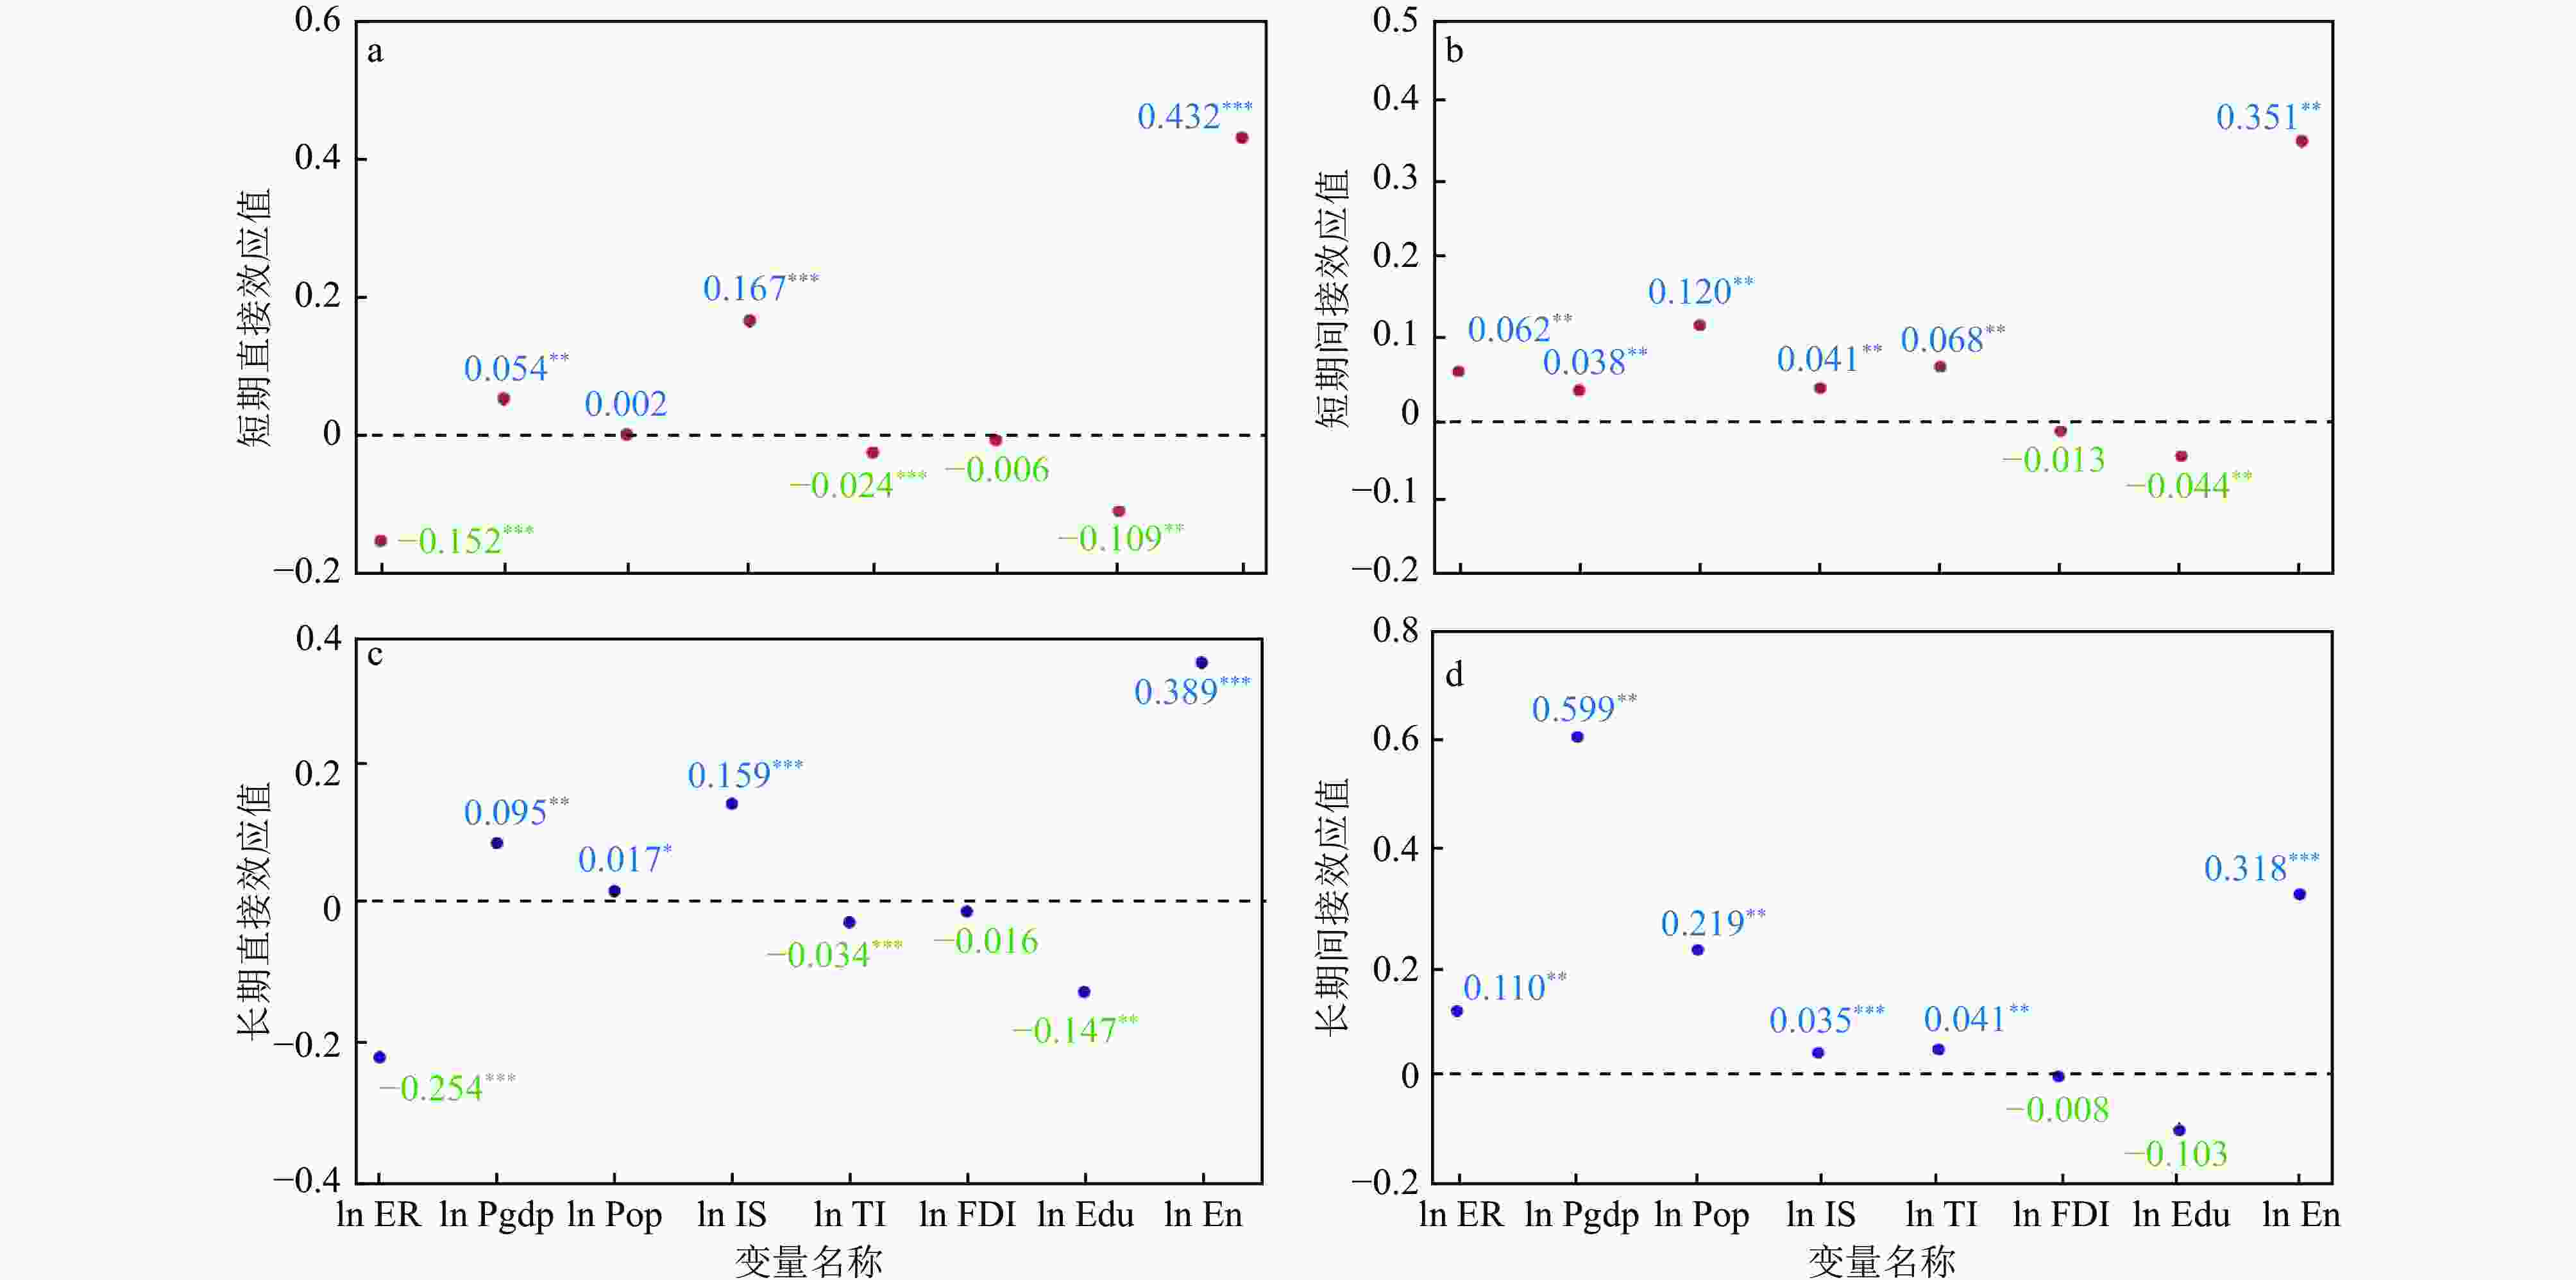
图 4 时空效应分解结果分布
注:*表示在0.1水平(双侧)上显著相关;**表示在0.05水平(双侧)上显著相关;***表示在0.01水平(双侧)上显著相关. 下同.
Figure 4. Distribution of spatial and temporal effect decomposition outcomes

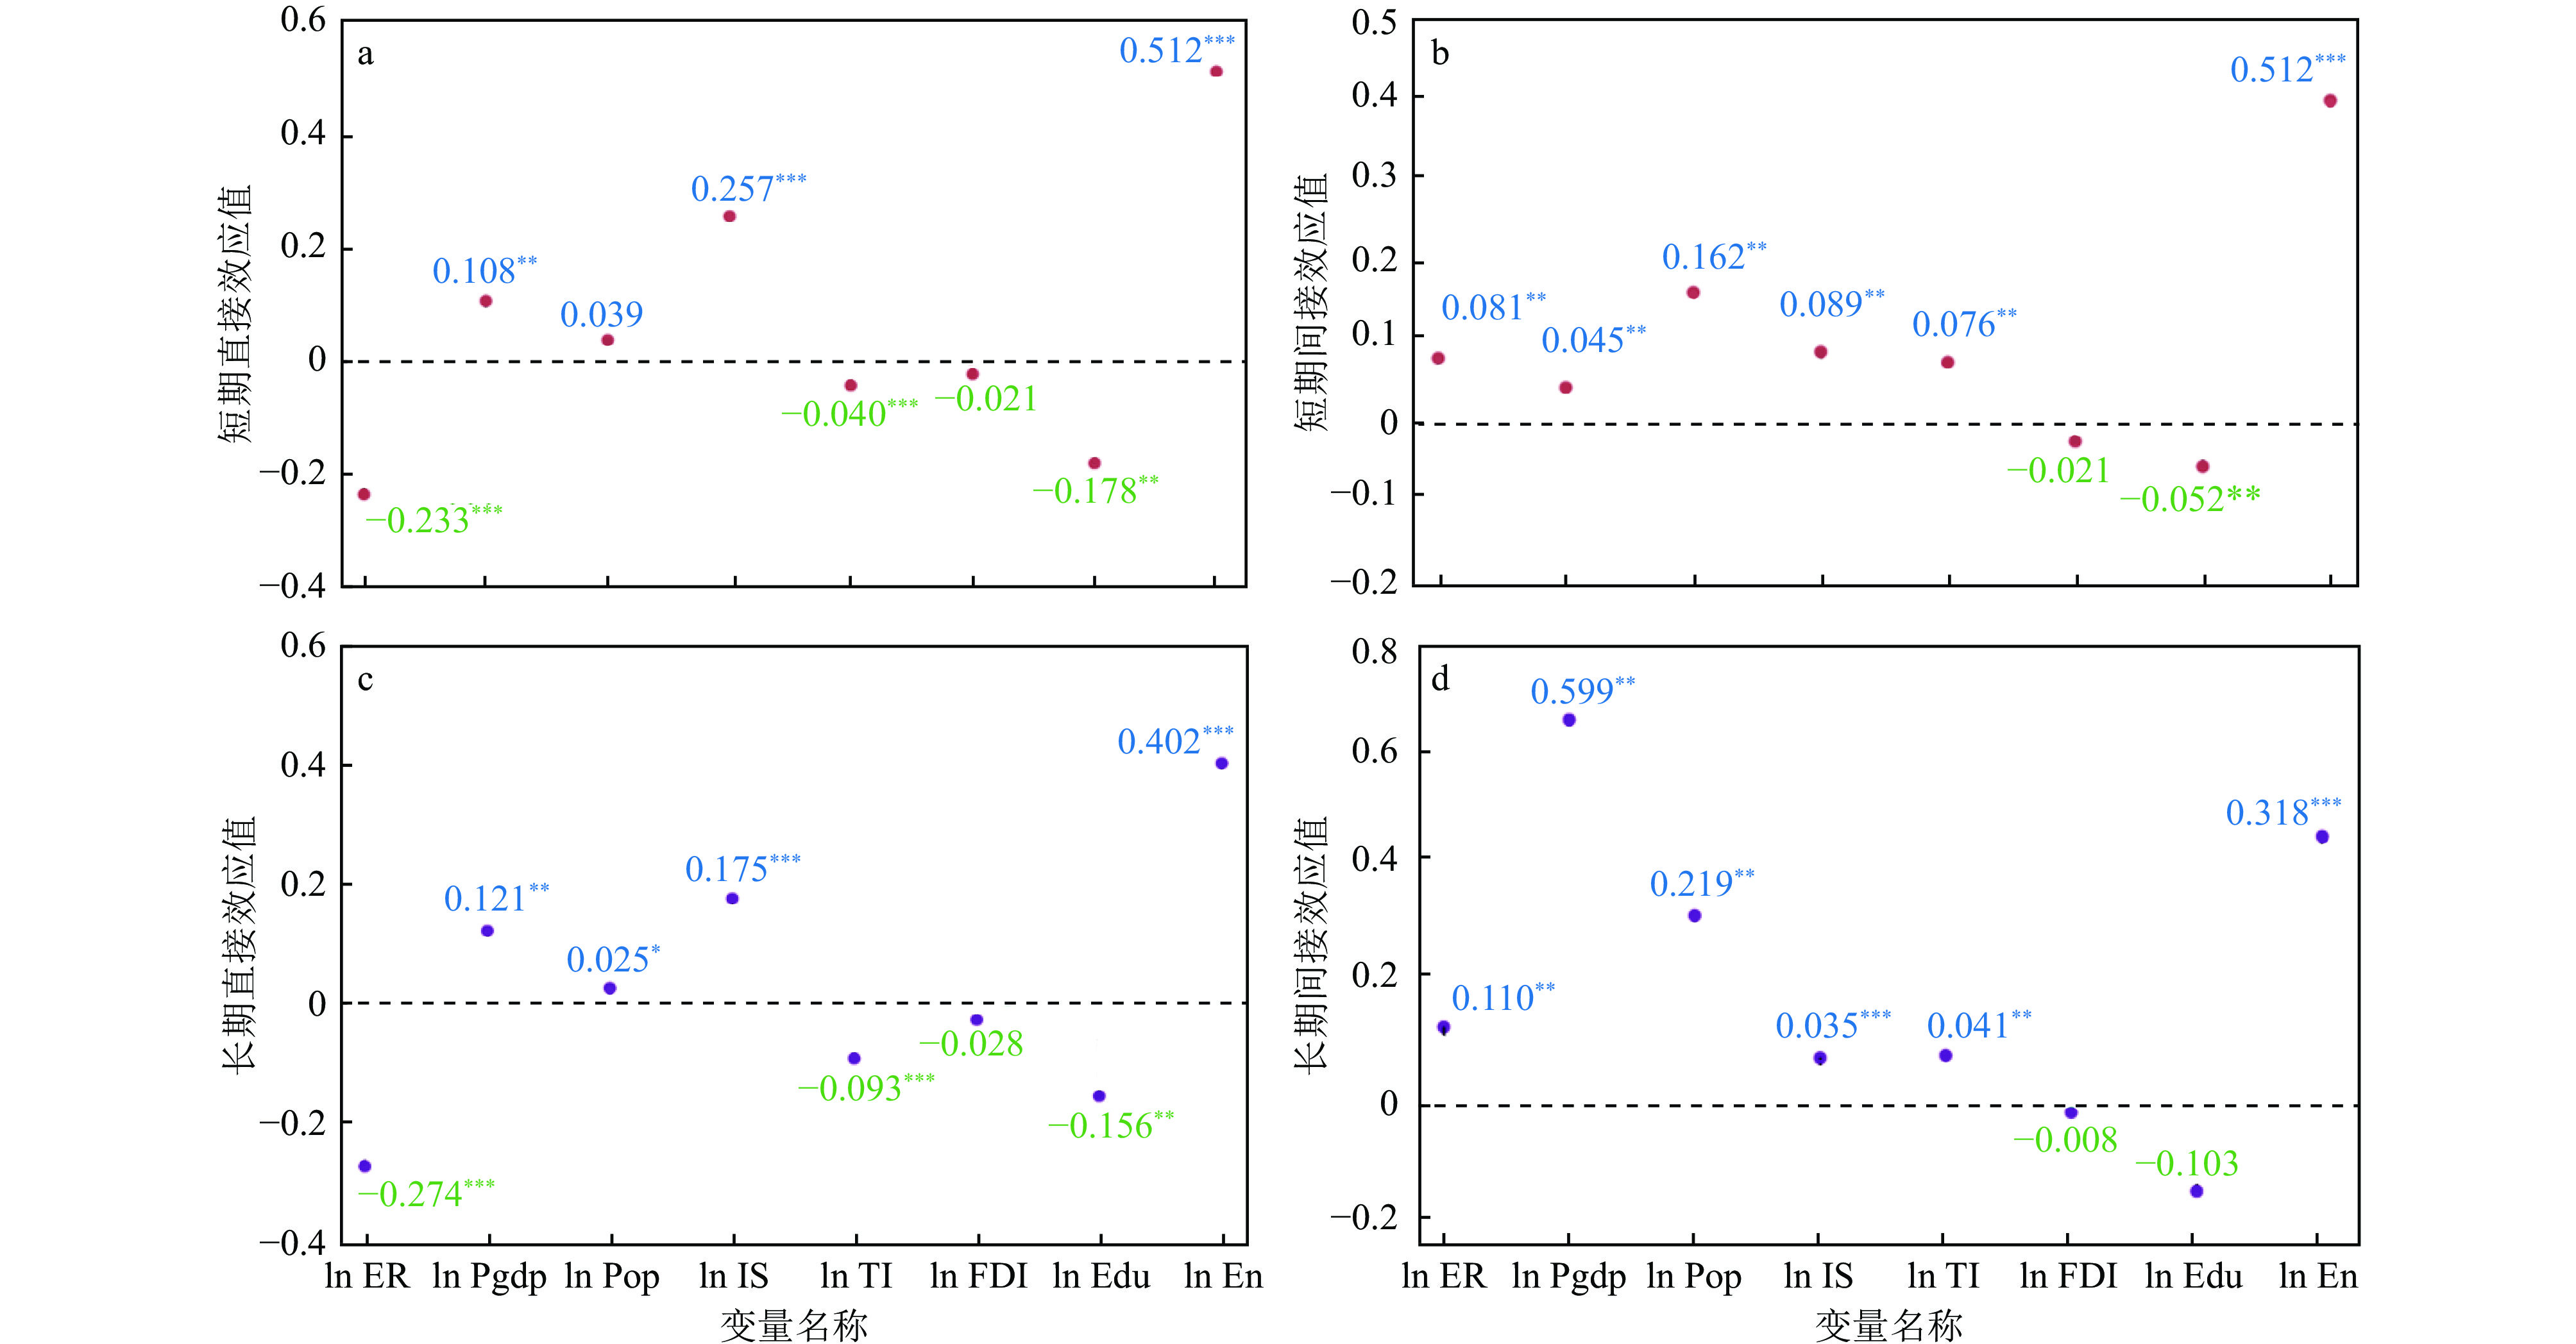
图 5 时空效应的稳健性检验结果
Figure 5. The results of a test of the robustness of spatiotemporal effects
表 1 变量选择和表征方法
Table 1. Methods for variable selection and characterization
类型 名称 简写 计算或表征方法 被解释变量 碳排放 CE 见式(1) 核心解释变量 环境规制强度 ER 见式(3)~(5) 控制变量 经济发展水平 Pgdp 人均GDP 人口规模 Pop 年末总人口 产业结构 IS 第二产业总值/GDP生产总值 技术创新 TI 发明专利申请量 外商直接投资 FDI 实际利用外资 受教育水平 Edu 每万人大学生数 能源消耗强度 EN 能源消耗总量/GDP  下载: 导出CSV
表 2 2006—2019年长三角地区CO2排放全局Moran's I指数
Table 2. Global Moran's I carbon dioxide emissions index for the Yangtze River Delta from 2006 to 2019
年份 Moran's I 年份 Moran's I 2006 0.411*** 2013 0.388*** 2007 0.420*** 2014 0.380*** 2008 0.416*** 2015 0.385*** 2009 0.410*** 2016 0.379*** 2010 0.408*** 2017 0.379*** 2011 0.396*** 2018 0.375*** 2012 0.396*** 2019 0.368*** 注:*表示在0.1水平(双侧)上显著相关;**表示在0.05水平(双侧)上显著相关;***表示在0.01水平(双侧)上显著相关. 下同.
下载: 导出CSV
表 3 空间面板计量模型检验结果
Table 3. Spatial panel econometric model test results
检验类型 统计值 检验类型 统计值 LM-spatial error 38.62*** Wald-spatial error 51.01*** Robust LM-spatial error 211.71*** Wald-spatial lag 48.42*** LM-spatial lag 35.53*** LR-spatial error 49.83*** Robust LM-spatial lag 5.79*** LR-spatial lag 71.36*** Hausman检验 416.82***
下载: 导出CSV
表 4 动态空间杜宾模型计量回归结果
Table 4. Dynamic Spatial Durbin Model econometric regression results
变量 回归系数 变量 回归系数 Lw×C 0.452*** Wx×ln ER 0.061*** ln ER −0.156** Wx×ln Pgdp 0.302*** ln Pgdp 0.053** Wx×ln Pgdp2 −0.116*** ln Pgdp2 −0.032** Wx×ln pop 0.116*** ln pop 0.027 Wx×ln IS 0.042* ln IS 0.166*** Wx×ln TI 0.071*** ln TI −0.025*** Wx×ln FDI −0.011 ln FDI −0.007 Wx×ln Edu 0.045 ln Edu −0.015** Wx×ln En 0.085** ln En 0.244** R2 0.912
下载: 导出CSV
-
[1] TOLLEFSON J.IPCC climate report:earth is warmer than it's been in 125,000 years[J].Nature,2021,596(7871):171-172. doi: 10.1038/d41586-021-02179-1 [2] MEEHL G A,TENG H Y,ARBLASTER J M.Climate model simulations of the observed early-2000s hiatus of global warming[J].Nature Climate Change,2014,4(10):898-902. doi: 10.1038/nclimate2357 [3] ZHENG J L,MI Z F,COFFMAN D,et al.The slowdown in China's carbon emissions growth in the new phase of economic development[J].One Earth,2019,1(2):240-253. doi: 10.1016/j.oneear.2019.10.007 [4] 彭水军,张文城,孙传旺.中国生产侧和消费侧碳排放量测算及影响因素研究[J].经济研究,2015,50(1):168-182.PENG S J,ZHANG W C,SUN C W.China's production-based and consumption-based carbon emissions and their determinants[J].Economic Research Journal,2015,50(1):168-182. [5] WEN L,LI Z K.Provincial-level industrial CO2 emission drivers and emission reduction strategies in China:combining two-layer LMDI method with spectral clustering[J].Science of the Total Environment,2020,700:134374. doi: 10.1016/j.scitotenv.2019.134374 [6] 唐湘博,张野,曹利珍,等.中国减污降碳协同效应的时空特征及其影响机制分析[J].环境科学研究,2022,35(10):2252-2263.TANG X B,ZHANG Y,CAO L Z,et al.Spatio-temporal characteristics and influencing mechanism of synergistic effect of pollution and carbon emission reduction in China[J].Research of Environmental Sciences,2022,35(10):2252-2263. [7] 王兆峰,李竹,吴卫.长江经济带不同等级城市碳排放的时空演变及其影响因素[J].环境科学研究,2022,35(10):2273-2281.WAMG Z F,LI Z,WU W.Spatio-temporal evolution and influencing factors of carbon emissions in different grade cities in the Yangtze River Economic Belt[J].Research of Environmental Sciences,2022,35(10):2273-2281. [8] LIU L W,CHEN C X,ZHAO Y F,et al.China's carbon-emissions trading:overview,challenges and future[J].Renewable and Sustainable Energy Reviews,2015,49:254-266. doi: 10.1016/j.rser.2015.04.076 [9] 王少剑,高爽,黄永源,等.基于超效率SBM模型的中国城市碳排放绩效时空演变格局及预测[J].地理学报,2020,75(6):1316-1330. doi: 10.11821/dlxb202006016WANG S J,GAO S,HUANG Y Y,et al.Spatio-temporal evolution and trend prediction of urban carbon emission performance in China based on super-efficiency SBM model[J].Acta Geographica Sinica,2020,75(6):1316-1330. doi: 10.11821/dlxb202006016 [10] ZHOU B,ZHANG C,SONG H Y,et al.How does emission trading reduce China's carbon intensity?an exploration using a decomposition and difference-in-differences approach[J].Science of the Total Environment,2019,676:514-523. doi: 10.1016/j.scitotenv.2019.04.303 [11] ZHANG W,LI G X,UDDIN M K,et al.Environmental regulation,foreign investment behavior,and carbon emissions for 30 provinces in China[J].Journal of Cleaner Production,2020,248:119208. doi: 10.1016/j.jclepro.2019.119208 [12] NIE X,WU J X,CHEN Z P,et al.Can environmental regulation stimulate the regional Porter effect?double test from quasi-experiment and dynamic panel data models[J].Journal of Cleaner Production,2021,314:128027. doi: 10.1016/j.jclepro.2021.128027 [13] 蒋培培,王远,罗进,等.长江与黄河流域碳排放效率时空演变特征及路径识别探究[J].环境科学研究,2022,35(7):1743-1751.JIANG P P,WANG Y,LUO J,et al.Comparative study of spatial-temporal evolution and growth path of carbon emissions efficiency in Yangtze River Basin and Yellow River Basin[J].Research of Environmental Sciences,2022,35(7):1743-1751. [14] 李菁,李小平,郝良峰.技术创新约束下双重环境规制对碳排放强度的影响[J].中国人口·资源与环境,2021,31(9):34-44.LI J,LI X P,HAO L F.Impact of dual environmental regulations on carbon emission intensity under the constraint of technological innovation[J].China Population,Resources and Environment,2021,31(9):34-44. [15] 王雅楠,左艺辉,陈伟,等.环境规制对碳排放的门槛效应及其区域差异[J].环境科学研究,2018,31(4):601-608. doi: 10.13198/j.issn.1001-6929.2017.03.92WANG Y N,ZUO Y H,CHEN W,et al.Threshold effect and regional differences of environmental regulation on carbon emission[J].Research of Environmental Sciences,2018,31(4):601-608. doi: 10.13198/j.issn.1001-6929.2017.03.92 [16] 李莉,董棒棒,敬盼.环境规制背景下新疆能源碳排放峰值预测与情景模拟研究[J].生态与农村环境学报,2020,36(11):1444-1452. doi: 10.19741/j.issn.1673-4831.2019.0903LI L,DONG B B,JING P.Prediction and scenario simulation of energy carbon emission peak in Xinjiang under the background of environmental regulation[J].Journal of Ecology and Rural Environment,2020,36(11):1444-1452. doi: 10.19741/j.issn.1673-4831.2019.0903 [17] XU Q,DONG Y X,YANG R,et al.Temporal and spatial differences in carbon emissions in the Pearl River Delta based on multi-resolution emission inventory modeling[J].Journal of Cleaner Production,2019,214:615-622. doi: 10.1016/j.jclepro.2018.12.280 [18] 潘栋,李楠,李锋,等.基于能源碳排放预测的中国东部地区达峰策略制定[J].环境科学学报,2021,41(3):1142-1152. doi: 10.13671/j.hjkxxb.2020.0325PAN D,LI N,LI F,et al.Mitigation strategy of eastern China based on energy-source carbon emission estimation[J].Acta Scientiae Circumstantiae,2021,41(3):1142-1152. doi: 10.13671/j.hjkxxb.2020.0325 [19] 万文玉,赵雪雁,王伟军,等.我国农村居民生活能源碳排放的时空特征分析[J].生态学报,2017,37(19):6390-6401.WAN W Y,ZHAO X Y,WANG W J,et al.Analysis of spatio-temporal patterns of carbon emission from energy consumption by rural residents in China[J].Acta Ecologica Sinica,2017,37(19):6390-6401. [20] 尹章才,康自强.时间地理支持下的核密度估计研究进展[J].地理科学进展,2022,41(1):64-72. doi: 10.18306/dlkxjz.2022.01.006YIN Z C,KANG Z Q.Advances in kernel density estimation supported by time geography[J].Progress in Geography,2022,41(1):64-72. doi: 10.18306/dlkxjz.2022.01.006 [21] 于斌斌,苏宜梅.土地财政如何影响土地利用效率?:基于规模与技术视角的动态空间杜宾模型检验[J].地理研究,2022,41(2):527-545. doi: 10.11821/dlyj020210006YU B B,SU Y M.How does land finance affect land use efficiency?dynamic space Durbin model test based on the perspective of scale and technology[J].Geographical Research,2022,41(2):527-545. doi: 10.11821/dlyj020210006 [22] WANG S J,ZENG J Y,HUANG Y Y,et al.The effects of urbanization on CO2 emissions in the Pearl River Delta:a comprehensive assessment and panel data analysis[J].Applied Energy,2018,228:1693-1706. doi: 10.1016/j.apenergy.2018.06.155 [23] WEN L,SHAO H Y.Influencing factors of the carbon dioxide emissions in China's commercial department:a non-parametric additive regression model[J].Science of the Total Environment,2019,668:1-12. doi: 10.1016/j.scitotenv.2019.02.412 [24] 贺灿飞,周沂.环境经济地理研究[M].北京:科学出版社,2016:175-176. [25] 赵霄伟.环境规制、环境规制竞争与地区工业经济增长:基于空间Durbin面板模型的实证研究[J].国际贸易问题,2014(7):82-92.ZHAO X W.Environmental regulation,environmental regulation competition and regional industrial economic growth:an empirical study based on spatial panel durbin model[J].Journal of International Trade,2014(7):82-92. [26] 黄莘绒,管卫华,陈明星,等.长三角城市群城镇化与生态环境质量优化研究[J].地理科学,2021,41(1):64-73. doi: 10.13249/j.cnki.sgs.2021.01.007HUANG X R,GUAN W H,CHEN M X,et al.Urbanization and optimization of the Yangtze River Delta urban agglomeration[J].Scientia Geographica Sinica,2021,41(1):64-73. doi: 10.13249/j.cnki.sgs.2021.01.007 [27] 仇方道,蒋涛,张纯敏,等.江苏省污染密集型产业空间转移及影响因素[J].地理科学,2013,33(7):789-796. doi: 10.13249/j.cnki.sgs.2013.07.003QIU F D,JIANG T,ZHANG C M,et al.Spatial relocation and mechanism of pollution-intensive industries in Jiangsu Province[J].Scientia Geographica Sinica,2013,33(7):789-796. doi: 10.13249/j.cnki.sgs.2013.07.003 [28] CHEN J D,XU C,LI K,et al.A gravity model and exploratory spatial data analysis of prefecture-scale pollutant and CO2 emissions in China[J].Ecological Indicators,2018,90:554-563. doi: 10.1016/j.ecolind.2018.03.057 [29] ZHAO W,LIU Y S,HUANG L H.Estimating environmental Kuznets Curve in the presence of eco-innovation and solar energy:an analysis of G-7 economies[J].Renewable Energy,2022,189:304-314. doi: 10.1016/j.renene.2022.02.120 [30] SHEN J,DENNIS WEI Y,YANG Z.The impact of environmental regulations on the location of pollution-intensive industries in China[J].Journal of Cleaner Production,2017,148:785-794. doi: 10.1016/j.jclepro.2017.02.050 [31] 崔建鑫,赵海霞.长江三角洲地区污染密集型产业转移及驱动机理[J].地理研究,2015,34(3):504-512.CUI J X,ZHAO H X.Spatial relocation of pollution-intensive industry and the mechanism in Yangtze River Delta[J].Geographical Research,2015,34(3):504-512. [32] 孙荪,姚丽,李杏,等.环境规制对FDI区位选择的影响研究:以江苏为例[J].工业技术经济,2012,31(3):145-150. doi: 10.3969/j.issn.1004-910X.2012.03.021SUN S,YAO L,LI X,et al.Study on effect of enviromental regulation on location choice of FDI:a case study of Jiangsu Province[J].Journal of Industrial Technological Economics,2012,31(3):145-150. doi: 10.3969/j.issn.1004-910X.2012.03.021 -


 点击查看大图
计量
- 文章访问数: 245
- HTML全文浏览量: 57
- PDF下载量: 81
- 被引次数: 0
