


Carbon Emissions by ‘the Belt and Road’ Countries: Impacts of Foreign Direct Investment and Development Factors
-
摘要: “一带一路”倡议下,推动绿色低碳发展,共建碳达峰、碳中和目标下国际合作共赢的生态圈,已经成为“一带一路”沿线国家的共识. 本文基于“一带一路”沿线国家1997—2018年的面板数据,通过逐步回归、异质性分析和门槛回归方法探究外商直接投资(FDI)的碳排放效应. 结果显示:①“一带一路”沿线国家FDI显著增加碳排放,体现出“污染天堂”效应. ②我国提出的“一带一路”倡议注重绿色低碳发展,削弱了“一带一路”沿线国家FDI对碳排放的“污染天堂”效应,体现出我国在环境治理特别是应对气候变化方面发挥的引领示范作用. ③经济发展可削弱FDI对碳排放的“污染天堂”效应,然而经济快速发展特别是工业发展可显著增加碳排放. ④政策、创新和发展三类机制均导致FDI的碳排放效应发生显著变化,其中发展机制影响最大,创新机制的碳减排效果相对稳定. ⑤强化环境规制促进了FDI的“污染光环”效应,“一带一路”倡议则推动“一带一路”沿线各国加强了环境规制. 研究显示,为促进“污染光环”效应形成,应深化绿色“一带一路”,利用来自中国投资的低碳化特征,增加与中国的投资往来并提高负有环境责任FDI的比例. “一带一路”沿线各国也应加强绿色低碳科技创新,在此基础上协同政策、创新和发展三类机制,引导FDI投向绿色低碳领域. 此外,还应综合运用环境准入机制和环境经济手段,实现高质量发展.Abstract: With ‘the Belt and Road’ Initiative, the consensus among the countries has been achieved to promote low-carbon development. Based on the panel data of ‘the Belt and Road’ Countries during 1997-2018, this paper explores the impacts of Foreign Direct Investment (FDI) on carbon emissions by stepwise regression, heterogeneity analysis and threshold regression. The results show that: (1) FDI to ‘the Belt and Road’ Countries has significantly increased carbon emissions, indicating the ‘pollution haven’ effect. (2) ‘The Belt and Road’ Initiative proposed by China in 2013 focuses on green development, which helps to weaken the ‘pollution haven’ effect of FDI on carbon emissions in ‘the Belt and Road’ Countries. It reflects China's leading role in global environmental governance, especially in climate change response. (3) Economic development can weaken the ‘pollution haven’ effect of FDI on carbon emissions, but rapid economic development, especially industrial growth, significantly increases carbon emissions. (4) Policy, innovation and development mechanisms all lead to significant changes in the carbon emission effect of FDI, among which the development mechanism has the greatest influence, while the innovation mechanism is the most effective. (5) Strengthening environmental regulations promotes the ‘pollution halo’ effect of FDI. ‘The Belt and Road’ Initiative plays an important role in strengthening environmental regulation in ‘the Belt and Road’ Countries. Therefore, in order to promote the ‘pollution halo’ effect of FDI, the green ‘Belt and Road’ initiative should be reinforced and the low-carbon investments from China or other environmentally responsible FDI should be introduced. It is also necessary to strengthen the innovation in low-carbon science and technologies. With the technological improvement, policies, innovation and development mechanisms can be coordinated to guide FDIs into green and low-carbon fields. In addition, a combination of environmental access mechanisms and environmental economic instruments should be used to achieve high-quality development.
-

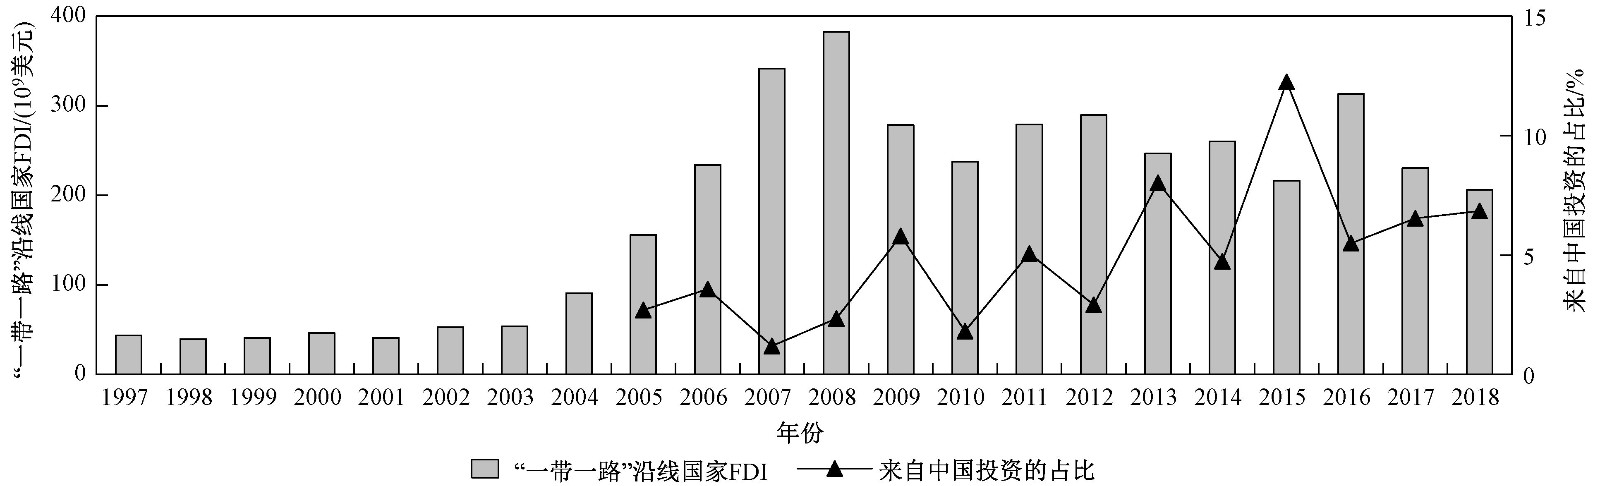
图 1 “一带一路”沿线国家FDI(1997—2018年)及来自中国投资的占比(2005—2018年)
注:数据来源于世界银行、国研网“一带一路”研究与决策支撑平台. 通过GDP平减指数将FDI换算为2010年不变价.
Figure 1. FDI (1997-2018) and share of investments from China (2005-2018) in ‘the Belt and Road’ Countries

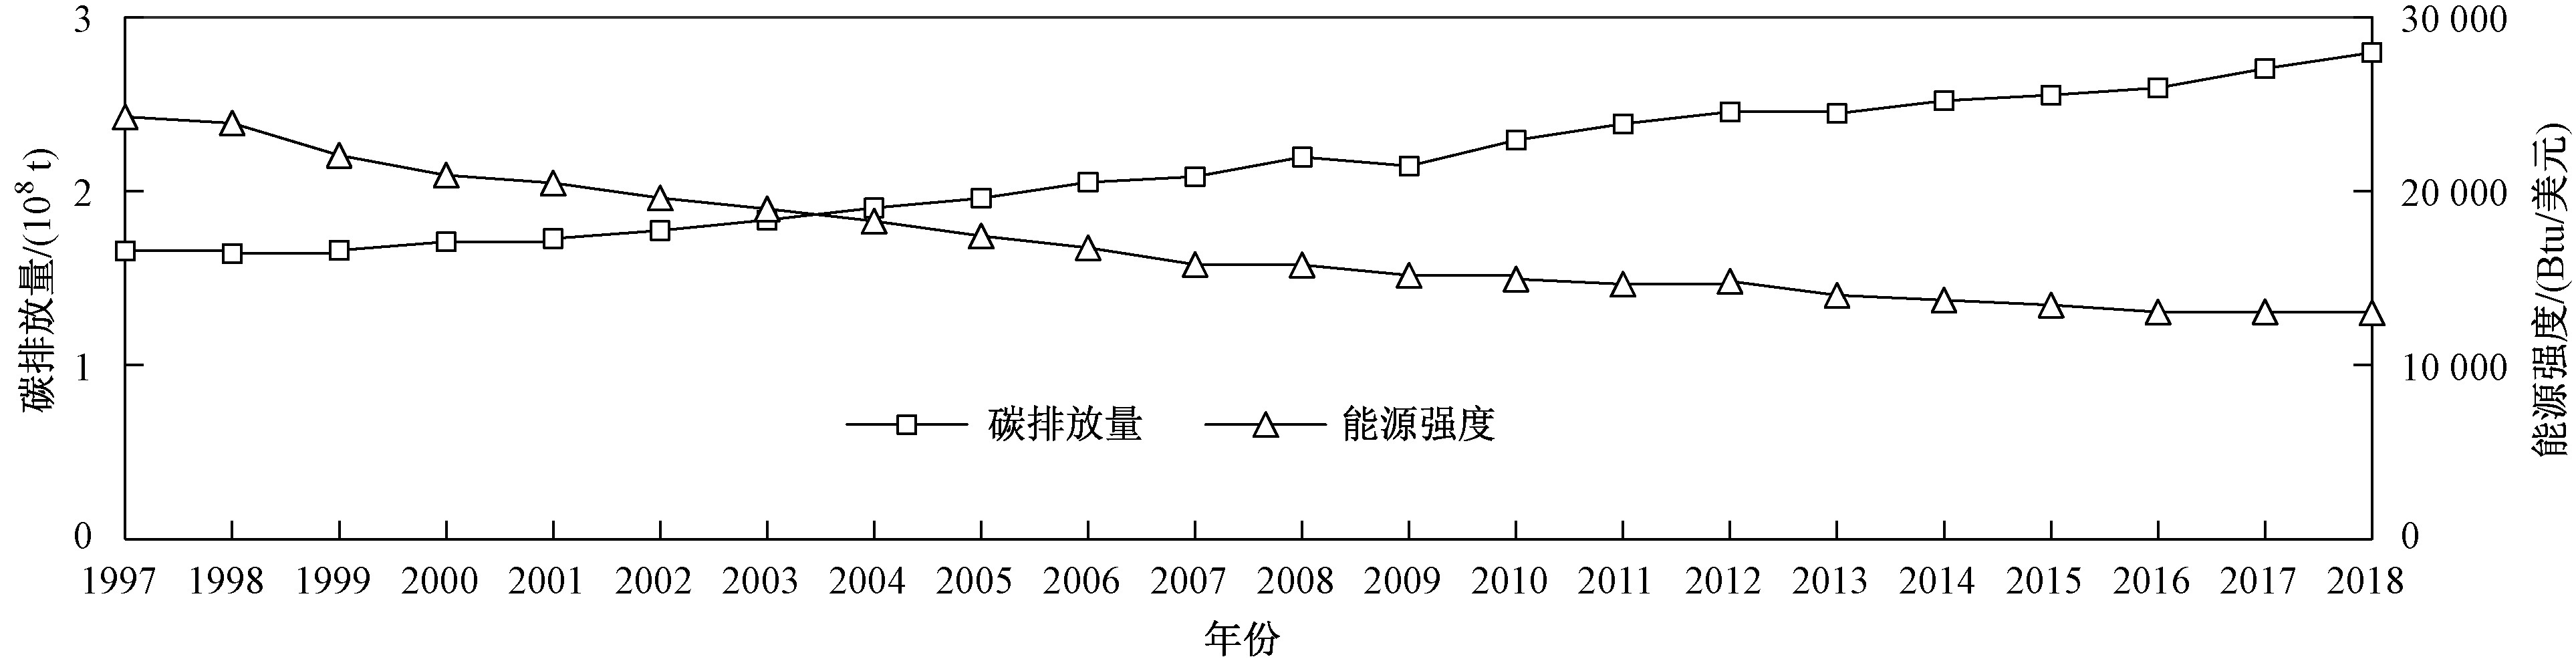
图 2 “一带一路”沿线国家碳排放量和能源强度(1997—2018年)
注:数据来源于世界银行. 能源强度中GDP换算为2010年不变价.
Figure 2. CO2 emissions and energy intensity in ‘the Belt and Road’ Countries (1997-2018)
表 1 变量描述性统计
Table 1. Descriptive statistics of variables
变量名称 含义 单位 平均值 标准差 最小值 最大值 FDI 外商直接投资流入 美元 5.619×10⁹ 9.885×10⁹ 0 7.167×10¹⁰ CAR 碳排放量 104 t 213 970.5 373 154.7 5 140 2 334 000 GDP 国内生产总值 106美元 258 107.4 383 797 785.4 2 826 588 IR 工业增加值占比 % 32.5 11.9 10.0 84.8 FR 化石能源占比 % 89.616 9.537 57.399 100 TE 进出口总额 106美元 162 339.9 190 990.2 825.6 1 258 148.6 UR 城市人口数 人 43 078 477 1.417×10⁸ 282 659 8.923×10⁸ EI 能源强度 Btu/美元 16 999.56 16 939.44 3 216.64 138 274.66 注:数据来源于世界银行数据库、英国石油公司(BP)数据库. 为消除通货膨胀因素的影响,通过GDP平减指数将以货币单位计量的变量换算为2010年不变价. 当国家未接收外商直接投资流入或撤资值大于流入值时,外商直接投资流入记为0;对外商直接投资流入取对数时,$ \ln\mathrm{F}\mathrm{D}\mathrm{I}=\ln(\mathrm{F}\mathrm{D}\mathrm{I}+1) $.  下载: 导出CSV
表 2 FDI及来自中国投资前10名的“一带一路”沿线国家(1997—2018年)
Table 2. Top 10 of ‘the Belt and Road’ Countries in FDI and investments from China (1997-2018)
排名 国家 FDI/(106美元) 排名 国家 中国投资/
(106美元)排名 国家 来自中国投资的占比/% 1 俄罗斯 517 458.69 1 俄罗斯 33 860 1 伊拉克 96.30 2 印度 457 667.86 2 印尼 24 090 2 巴基斯坦 39.76 3 塞浦路斯 355 367.36 3 哈萨克斯坦 19 070 3 斯里兰卡 33.54 4 匈牙利 313 116.72 4 马来西亚 18 980 4 希腊 23.77 5 波兰 263 303.87 5 印度 16 780 5 哈萨克斯坦 14.04 6 沙特阿拉伯 224 162.03 6 巴基斯坦 14 900 6 马来西亚 12.91 7 印尼 196 433.22 7 伊拉克 11 820 7 印尼 12.26 8 土耳其 196 406.61 8 以色列 9 820 8 伊朗 10.51 9 以色列 168 987.84 9 希腊 9 750 9 斯洛文尼亚 8.27 10 捷克 155 889.01 10 越南 5 880 10 乌兹别克斯坦 7.90 注:数据来源于世界银行以及国研网“一带一路”研究与决策支撑平台. 通过GDP平减指数将FDI换算为2010年不变价.
下载: 导出CSV
表 3 碳排放量及其增长率和下降率前10名的“一带一路”沿线国家(1997—2018年)
Table 3. Top 10 of ‘the Belt and Road’ Countries by carbon emissions, growth rates and reduction rates (1997-2018)
排名 国家 碳排放量年均值/(103 t) 排名 国家 碳排放量增长率/% 排名 国家 碳排放量下降率/% 1 俄罗斯 1 635 949 1 越南 671.3 1 乌克兰 43.7 2 印度 1 438 799 2 阿曼 369.5 2 罗马尼亚 39.2 3 伊朗 473 223.2 3 印度 194.8 3 保加利亚 24.0 4 沙特阿拉伯 433 699.5 4 斯里兰卡 158.4 4 斯洛伐克 20.7 5 印尼 357 757.3 5 伊朗 152.6 5 捷克 14.4 6 乌克兰 308 870.5 6 马来西亚 142.4 6 爱沙尼亚 14.3 7 波兰 308 660.9 7 印尼 130.4 7 希腊 13.8 8 土耳其 272 010 8 沙特阿拉伯 124.5 8 北马其顿 12.4 9 哈萨克斯坦 234 918.6 9 伊拉克 124.2 9 阿塞拜疆 12.3 10 埃及 175 965.5 10 巴基斯坦 118.2 10 斯洛文尼亚 11.2 注:数据来源于世界银行.
下载: 导出CSV
表 4 FDI碳排放效应逐步回归结果
Table 4. Stepwise regression results of FDI on carbon emission
变量 ln CAR 步骤1 步骤2 步骤3 步骤4 步骤5 步骤6 ln FDI 0.005 8*(0.003 2) 0.005 2***(0.001 8) 0.005 2***(0.001 8) 0.004 8**(0.001 8) 0.004 2**(0.001 9) 0.004 1**(0.001 9) ln GDP 0.572 9*(0.307 6) 0.593 2**(0.290 3) 0.524 1*(0.303 4) 0.676 7**(0.259 0) 0.497 2*(0.265 0) IR −0.002 8(0.006 9) −0.002 0(0.006 7) 0.000 7(0.008 1) 0.001 6(0.007 7) FR 0.010 8(0.010 7) 0.009 9(0.009 3) 0.009 9(0.007 2) ln TE −0.176 2(0.216 5) −0.116 1(0.214 6) ln UR 0.692 2**(0.288 1) 常数项 11.035 6***(0.083 5) 4.659 2(3.449 6) 4.521 8(3.287 6) 4.302 4(3.140 4) 4.486 2(3.299 6) −5.068 7(4.884 5) 样本量 726 726 726 726 726 726 R2 0.245 6 0.353 1 0.354 8 0.377 5 0.394 3 0.440 3 注:***、**、*分别代表1%、5%、10%显著性水平. 括号中的数值为异方差-稳健标准误. 使用逐步回归方法,按照步骤1~6逐个引入控制变量进行回归,并保证各步骤回归的F值显著,既保证模型中各控制变量的重要性,又避免多重共线性. 下同.
下载: 导出CSV
表 5 FDI的碳排放效应异质性分析结果
Table 5. Heterogeneity analysis results of FDI on carbon emission
变量 ln CAR 政策机制 创新机制 发展机制 1997—2013年 2014—2018年 研发投入占比
大于1%研发投入占比
小于1%人均GDP
大于10 000美元人均GDP
小于10 000美元ln FDI 0.003 1*(0.001 7) −0.000 3(0.000 5) 0.001 9(0.001 7) 0.005 0**(0.002 2) −0.000 8(0.002 4) 0.005 4*(0.003 1) ln GDP 0.154 6(0.270 9) 0.893 1***(0.221 5) 1.094 2***(0.221 0) 0.053 3(0.283 3) 1.030 9***(0.178 5) 0.393 5(0.331 0) IR 0.008 4(0.007 8) 0.006 2(0.004 9) −0.005 1(0.009 5) 0.003 1(0.007 8) 0.018 5***(0.005 6) −0.007 0(0.008 9) FR 0.010 7(0.007 2) 0.010 4***(0.002 6) −0.001 3(0.001 3) 0.034 5***(0.008 4) 0.023 1*(0.012 3) 0.006 9(0.007 2) ln TE −0.076 2(0.1835) 0.042 8(0.117 8) −0.542 3**(0.189 1) 0.070 3(0.238 2) −0.538 4**(0.176 9) 0.001 7(0.258 6) ln UR 0.773 0**(0.2833) 0.104 8(0.5172) −0.669 3*(0.3231) 0.666 3**(0.296 9) 0.223 7(0.354 6) 0.649 4**(0.271 6) 常数项 −3.216 0(5.2739) −2.422 2(8.3593) 15.089 7**(5.897 0) −4.282 1(4.873 3) −0.928 7(5.749 8) −4.148 5(5.817 8) 样本量 561 165 242 484 264 462 R2 0.427 2 0.533 8 0.637 2 0.519 5 0.639 6 0.439 6
下载: 导出CSV
表 6 “一带一路”沿线国家投资、消费和出口对GDP影响的回归结果
Table 6. Regression results of the impact of investment, consumption and export on GDP in ‘the Belt and Road’ Countries
变量 ln GDP 1997—2018年 1997—2013年 2014—2018年 ln CAP 0.175 6***(0.056 2) 0.131 2**(0.049 1) 0.122 5*(0.065 0) ln UR 0.356 0**(0.151 4) 0.228 5(0.183 2) 0.408 5**(0.191 8) ln EX 0.234 3***(0.0742) 0.260 2***(0.092 4) 0.105 6(0.076 8) 常数项 1.520 0 (2.598 2) 3.693 6 (3.301 7) 2.954 9 (3.204 5) 样本量 726 561 165 R2 0.910 7 0.897 2 0.813 4
下载: 导出CSV
表 7 FDI碳排放效应门槛回归结果
Table 7. Threshold regression results of FDI on carbon emissions
变量 ln CAR ln GDP 0.716 1***(0.056 0) IR 0.001 8(0.001 7) FR 0.010 8***(0.001 7) ln TE −0.128 6***(0.032 3) ln UR 0.356 4***(0.077 0) ln FDI $ (\mathrm{E}\mathrm{I}\leqslant 13\;970.57) $ −0.002 6*(0.001 4) ln FDI $(13\;970.57 < \mathrm{E}\mathrm{I}\leqslant 35\;953.29)$ 0.013 8***(0.001 5) ln FDI $ (35\;953.29 < \mathrm{E}\mathrm{I}) $ 0.032 3***(0.002 1) 常数项 −2.300 8**(1.136 6) 样本量 726 R2 0.647 3
下载: 导出CSV
-
[1] 邬娜,傅泽强,王艳华,等.“一带一路”沿线国家碳排放EKC检验及脱钩关系分析[J].环境工程技术学报,2018,8(6):671-678. doi: 10.3969/j.issn.1674-991X.2018.06.089WU N,FU Z Q,WANG Y H,et al.EKC test and decoupling analysis of carbon emissions in countries along the ‘One Belt and One Road’[J].Journal of Environmental Engineering Technology,2018,8(6):671-678. doi: 10.3969/j.issn.1674-991X.2018.06.089 [2] YANG Y F,WANG H,LÖSCHEL A,et al.Patterns and determinants of carbon emission flows along ‘the Belt and Road’ from 2005 to 2030[J].Ecological Economics,2022,192:107260. doi: 10.1016/j.ecolecon.2021.107260 [3] WANG J D,DONG K Y,DONG X C,et al.Research on the carbon emission effect of the seven regions along ‘the Belt and Road’:based on the spillover and feedback effects model[J].Journal of Cleaner Production,2021,319:128758. doi: 10.1016/j.jclepro.2021.128758 [4] MARIOTTI S,MARZANO R.The effects of competition policy,regulatory quality and trust on inward FDI in host countries[J].International Business Review,2021,30(6):101887. doi: 10.1016/j.ibusrev.2021.101887 [5] CAI X Q,LU Y,WU M Q,et al.Does environmental regulation drive away inbound foreign direct investment?evidence from a quasi-natural experiment in China[J].Journal of Development Economics,2016,123:73-85. doi: 10.1016/j.jdeveco.2016.08.003 [6] DUAN Y W,JIANG X M.Pollution haven or pollution halo?a reevaluation on the role of multinational enterprises in global CO2 emissions[J].Energy Economics,2021,97:105181. doi: 10.1016/j.eneco.2021.105181 [7] PAZIENZA P.The impact of FDI in the OECD manufacturing sector on CO2 emission:evidence and policy issues[J].Environmental Impact Assessment Review,2019,77:60-68. doi: 10.1016/j.eiar.2019.04.002 [8] 魏玮,周晓博,薛智恒.环境规制对不同进入动机FDI的影响:基于省际面板数据的实证研究[J].国际商务(对外经济贸易大学学报),2017(1):110-119.WEI W,ZHOU X B,XUE Z H.Effects of environmental regulation on FDI with different entering motivations:empirical study based on provincial panel data[J].International Business,2017(1):110-119. [9] 谢科进,蔡云芝,包尚艳.劳动力成本上升对我国吸引FDI的影响研究[J].管理世界,2018(7):166-167. doi: 10.3969/j.issn.1002-5502.2018.07.012XIE K J,CAI Y Z,BAO S Y.Research on the impact of labor cost rising on China's attraction of FDI[J].Management World,2018(7):166-167. doi: 10.3969/j.issn.1002-5502.2018.07.012 [10] 吕朝凤,毛霞.地方金融发展能够影响FDI的区位选择吗?一个基于城市商业银行设立的准自然实验[J].金融研究,2020(3):58-76.LYU C F,MAO X.Can local financial development affect the location selection of FDI?a quasi-natural experiment based on city commercial banks[J].Journal of Financial Research,2020(3):58-76. [11] WANG X Y,ZHANG C T,ZHANG Z J.Pollution haven or porter?the impact of environmental regulation on location choices of pollution-intensive firms in China[J].Journal of Environmental Management,2019,248:109248. doi: 10.1016/j.jenvman.2019.07.019 [12] ZHENG D,SHI M J.Multiple environmental policies and pollution haven hypothesis:evidence from China's polluting industries[J].Journal of Cleaner Production,2017,141:295-304. doi: 10.1016/j.jclepro.2016.09.091 [13] KATHURIA V,RAY P,BHANGAONKAR R.FDI (foreign direct investment) in wind energy sector in India:testing the effectiveness of state policies using panel data[J].Energy,2015,80:190-202. doi: 10.1016/j.energy.2014.11.062 [14] RAZZAQ A,AN H,DELPACHITRA S.Does technology gap increase FDI spillovers on productivity growth?evidence from Chinese outward FDI in ‘Belt and Road’ host countries[J].Technological Forecasting and Social Change,2021,172:121050. doi: 10.1016/j.techfore.2021.121050 [15] 黄杰.FDI对中国碳排放强度影响的门槛效应检验[J].统计与决策,2017(21):108-111. [16] BENZERROUK Z,ABID M,SEKRAFI H.Pollution haven or halo effect?a comparative analysis of developing and developed countries[J].Energy Reports,2021,7:4862-4871. doi: 10.1016/j.egyr.2021.07.076 [17] 金玲,郝成亮,吴立新,等.中国煤化工行业二氧化碳排放达峰路径研究[J].环境科学研究,2022,35(2):368-376.JIN L,HAO C L,WU L X,et al.Pathway of carbon emissions peak of China's coal chemical industry[J].Research of Environmental Sciences,2022,35(2):368-376. [18] GYAMFI B A,BEIN M A,UDEMBA E N,et al.Investigating the pollution haven hypothesis in oil and non-oil sub-Saharan Africa countries:evidence from quantile regression technique[J].Resources Policy,2021,73:102119. doi: 10.1016/j.resourpol.2021.102119 [19] 花瑞祥,蓝艳.中国与东盟贸易的环境效应及其关键社会经济因子影响分析[J].环境科学研究,2020,33(9):2210-2218.HUA R X,LAN Y.Environmental effect of free trade between China and ASEAN and impact analysis of key socio-economic factors[J].Research of Environmental Sciences,2020,33(9):2210-2218. [20] 禹湘,陈楠,李曼琪.中国低碳试点城市的碳排放特征与碳减排路径研究[J].中国人口·资源与环境,2020,30(7):1-9.YU X,CHEN N,LI M Q.Research on carbon emission characteristics and reduction pathways of low-carbon pilot cities in China[J].China Population,Resources and Environment,2020,30(7):1-9. [21] 杨海珍,李昌萌.“中等收入陷阱”存在与否及其影响因素[J].管理评论,2021,33(4):40-46.YANG H Z,LI C M.On the existence and influencing factors of middle income trap[J].Management Review,2021,33(4):40-46. [22] TALEBZADEHHOSSEINI S,GARIBAY I.The interaction effects of technological innovation and path-dependent economic growth on countries overall green growth performance[J].Journal of Cleaner Production,2022,333:130134. doi: 10.1016/j.jclepro.2021.130134 [23] BOMPARD E F,CORGNATI S P,GROSSO D,et al.Multidimensional assessment of the energy sustainability and carbon pricing impacts along ‘the Belt and Road’ Initiative[J].Renewable and Sustainable Energy Reviews,2022,154:111741. doi: 10.1016/j.rser.2021.111741 [24] 王雅楠,左艺辉,陈伟,等.环境规制对碳排放的门槛效应及其区域差异[J].环境科学研究,2018,31(4):601-608.WANG Y N,ZUO Y H,CHEN W,et al.Threshold effect and regional differences of environmental regulation on carbon emission[J].Research of Environmental Sciences,2018,31(4):601-608. [25] 郑强,冉光和,邓睿,等.中国FDI环境效应的再检验[J].中国人口·资源与环境,2017,27(4):78-86.ZHENG Q,RAN G H,DENG R,et al.re-examination on the environmental effect of FDI in China[J].China Population,Resources and Environment,2017,27(4):78-86. [26] ZHANG W,LI G X,UDDIN M K,et al.Environmental regulation,foreign investment behavior,and carbon emissions for 30 provinces in China[J].Journal of Cleaner Production,2020,248:119208. doi: 10.1016/j.jclepro.2019.119208 [27] 蔡博峰,吕晨,董金池,等.重点行业/领域碳达峰路径研究方法[J].环境科学研究,2022,35(2):320-328.CAI B F,LÜ C,DONG J C,et al.Research method for carbon peaking pathway in key industries/sectors[J].Research of Environmental Sciences,2022,35(2):320-328. [28] HU Y,YU Y,MARDANI A.Selection of carbon emissions control industries in China:an approach based on complex networks control perspective[J].Technological Forecasting and Social Change,2021,172:121030. doi: 10.1016/j.techfore.2021.121030 [29] 陈斌开.供给侧结构性改革与中国居民消费[J].学术月刊,2017,49(9):13-17. [30] GUIMÓN J,CHAMINADE C,MAGGI C,et al.Policies to attract R & D-related FDI in small emerging countries:aligning incentives with local linkages and absorptive capacities in Chile[J].Journal of International Management,2018,24(2):165-178. doi: 10.1016/j.intman.2017.09.005 [31] 张欢,徐康宁,孙文远.城镇化、教育质量与中等收入陷阱:基于跨国面板数据的实证分析[J].数量经济技术经济研究,2018,35(5):40-58.ZHANG H,XU K N,SUN W Y.Urbanization,education quality,and middle income trap[J].The Journal of Quantitative & Technical Economics,2018,35(5):40-58. -

 点击查看大图
计量
- 文章访问数: 487
- HTML全文浏览量: 95
- PDF下载量: 88
- 被引次数: 0
