


Characteristics of PM2.5 and O3 Pollution and Related Meteorological Impacts in ‘2+26’ Cities of Beijing-Tianjin-Hebei and Its Surrounding Areas from 2018 to 2021
-
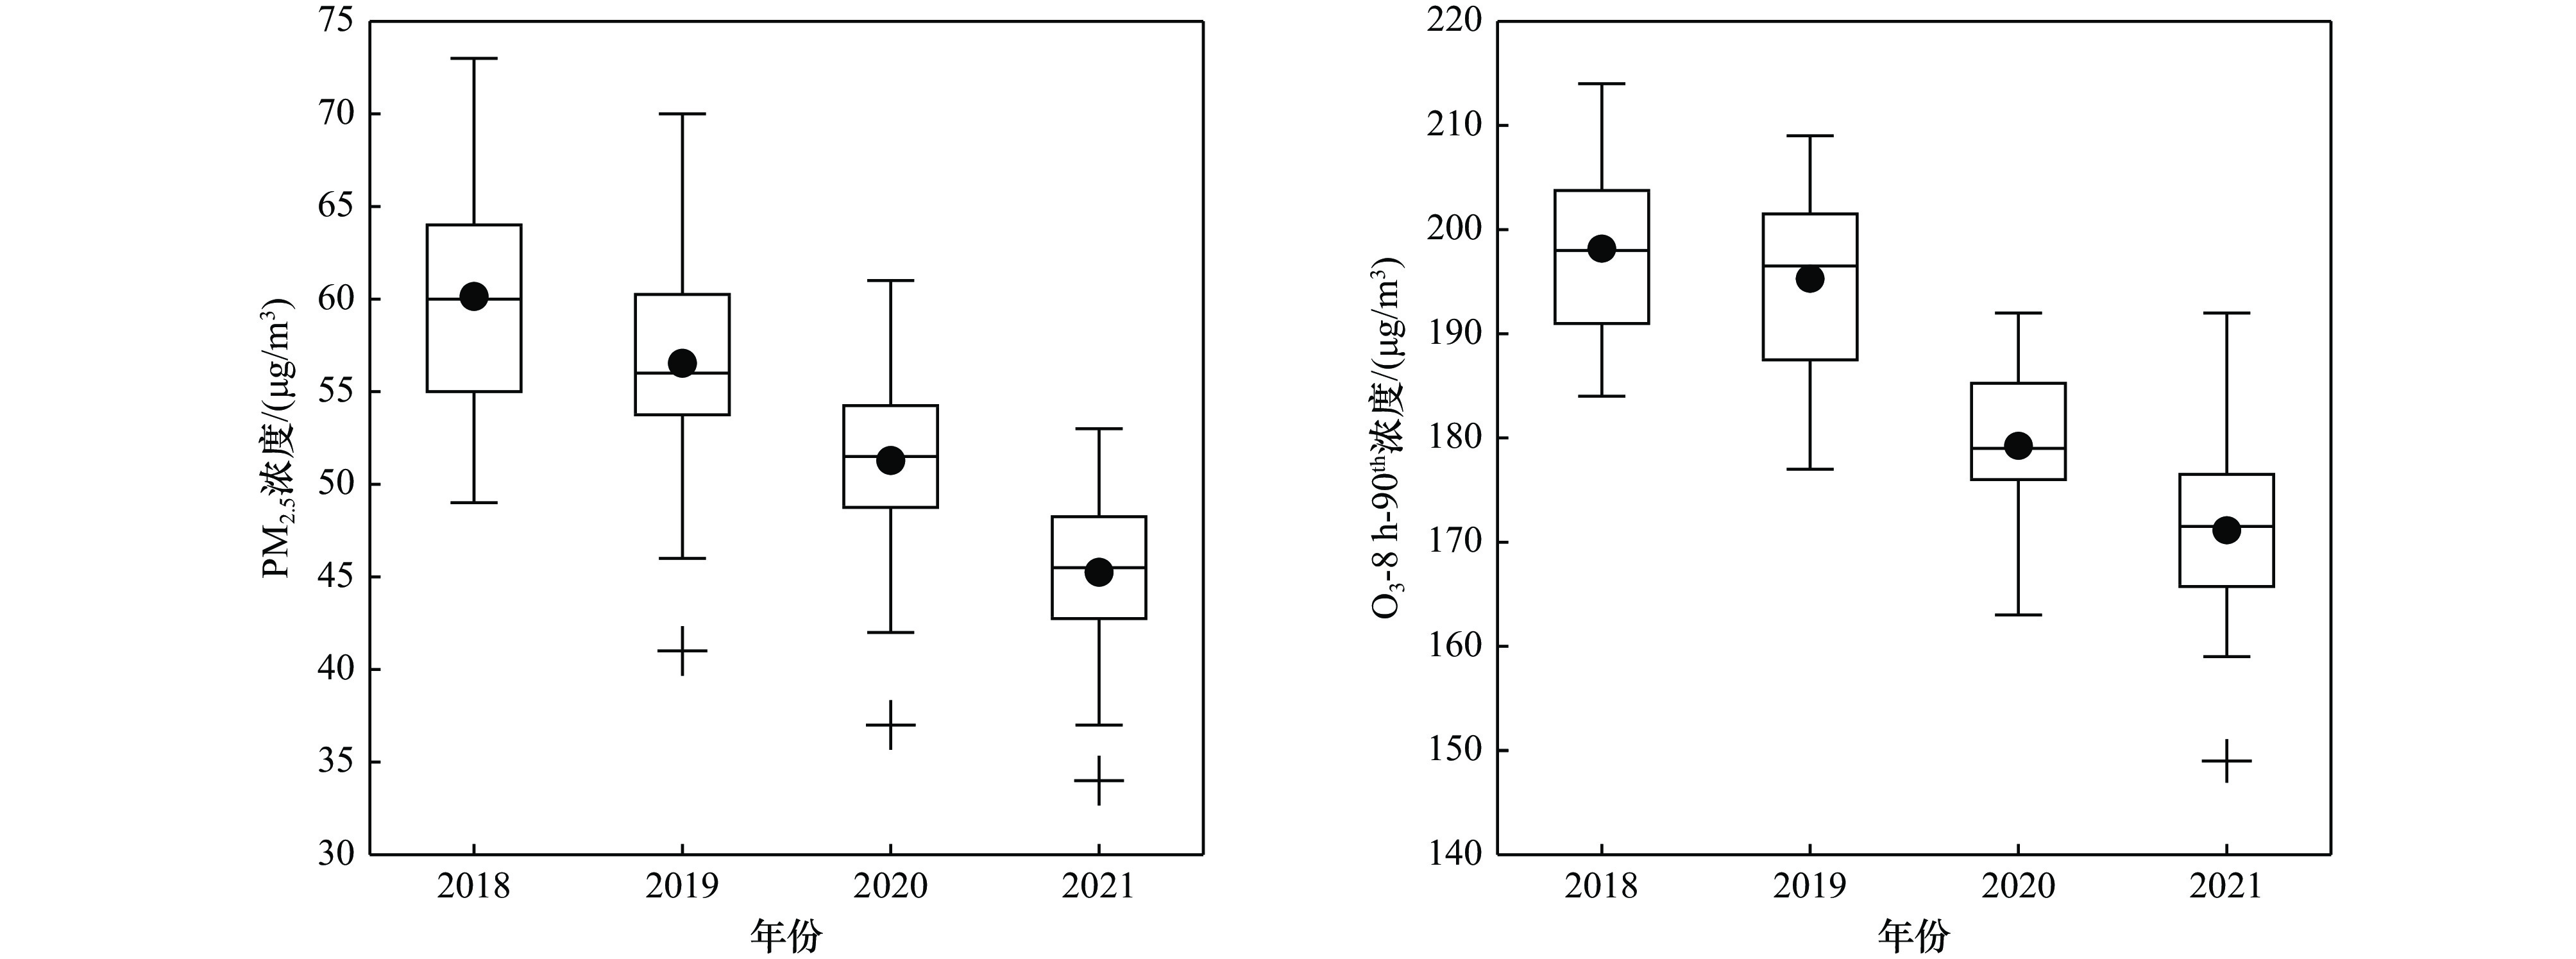
摘要: 为了解《打赢蓝天保卫战三年行动计划》期间(2018—2020年)以及之后(2021年)我国重点污染区域空气质量情况,并区分排放源控制与气象条件的贡献,本文利用逐小时监测的PM2.5、O3浓度以及气象要素数据,研究了2018—2021年京津冀及周边地区“2+26”城市PM2.5与O3污染特征,结合KZ (Kolmogorove Zurbenko)滤波方法定量分析了排放源与气象条件对PM2.5与O3浓度长期趋势的贡献. 结果表明:①2018—2021年“2+26”城市PM2.5浓度年均值与O3-8 h-90th浓度(O3日最大8 h平均浓度的第90百分位数)均呈逐年下降趋势. 2018—2021年PM2.5浓度年均值分别为60、57、51和45 μg/m3,河北省南部、河南省与山东省南部PM2.5浓度年均值均较高;O3-8 h-90th浓度分别为198、195、179和171 μg/m3,2018年保定市、石家庄市、聊城市与晋城市的O3-8 h-90th浓度(>210 μg/m3)均较高,而2021年太原市O3-8 h-90th浓度(192 μg/m3)较高. ②PM2.5与O3-8 h浓度(O3日最大8 h平均浓度)的长期分量在大部分城市受气象条件影响较为明显. 受气象条件影响的PM2.5浓度长期分量在2018—2020年无明显趋势,在2021年呈下降趋势;受排放源影响的PM2.5浓度长期分量在2018—2020年呈下降趋势,在2021年无明显趋势. 受气象条件影响的O3-8 h浓度长期分量在2018—2020年呈下降趋势,在2021年呈上升趋势;受排放源影响的O3-8 h浓度长期分量在2018年呈下降趋势,在2019—2021年无明显趋势. ③11个气象因子中,温度和相对湿度对PM2.5与O3-8 h浓度变化的影响较大,当温度与相对湿度均比前一天升高时,更有利于PM2.5与O3-8 h浓度的同时升高. 研究显示,“2+26”城市PM2.5与O3污染受气象条件影响显著,温度与相对湿度的变化对判定PM2.5与O3-8 h浓度同时升高的现象有一定积极意义.Abstract: In order to understand the air quality in key polluted areas in China, fine particulate matter (PM2.5) and ozone (O3) were studied during the Three-Year Action Plan to Win the Blue Sky Defense from 2018 to 2020 and in 2021. Specifically, the characteristics of PM2.5 and O3 compound pollution were analyzed using hourly monitoring data of PM2.5 and O3 in the ‘2+26’ cities of Beijing-Tianjin-Hebei and its surrounding areas. In addition, the contributions of emission sources and meteorological factors to the long-term trend of PM2.5 and O3 concentrations were quantified based on the KZ filter method. The results showed that in recent years, the annual mean PM2.5 and the 90th quantile of maximum daily 8-hour average ozone (O3-8 h-90th) concentrations decreased in the ‘2+26’ cities. The annual mean values of PM2.5 concentration from 2018 to 2021 were 60, 57, 51 and 45 μg/m3, respectively. The higher concentration of annual mean PM2.5 appeared in southern Hebei, Henan and southern Shandong provinces; O3-8 h-90th concentrations were 198, 195, 179 and 171 μg/m3, respectively. In 2018, O3-8 h-90th concentration was higher in Baoding, Shijiazhuang, Liaocheng and Jincheng (greater than 210 μg/m3), while Taiyuan O3-8 h-90th concentration was higher (192 μg/m3) in 2021. Furthermore, the long-term trend of PM2.5 and O3-8 h (maximum daily 8-hour average ozone) concentrations were more significantly influenced by meteorology. The long-term component of PM2.5 concentration affected by meteorology showed no obvious trend from 2018 to 2020 and a downward trend in 2021, while the long-term component of PM2.5 concentration affected by emissions showed a decreasing trend from 2018 to 2020 and no significant trend in 2021. The long-term component of O3-8 h concentration affected by meteorology showed an upward trend from 2018 to 2020 and a downward trend in 2021, while the long-term component of O3-8 h concentration affected by emissions showed a downward trend in 2018 and had no obvious trend from 2019 to 2021. Moreover, temperature and relative humidity had the greatest effect on both the concentration of PM2.5 and O3-8 h among the 11 meteorological factors. When the temperature and relative humidity increased together, it was more conducive to the simultaneous increase of PM2.5 and O3-8 h. The research shows that PM2.5 and O3 pollution in the ‘2+26’ cities are significantly affected by meteorology, and the changes in temperature and relative humidity are important in determining the simultaneous increase of PM2.5 and O3-8 h concentrations.
-
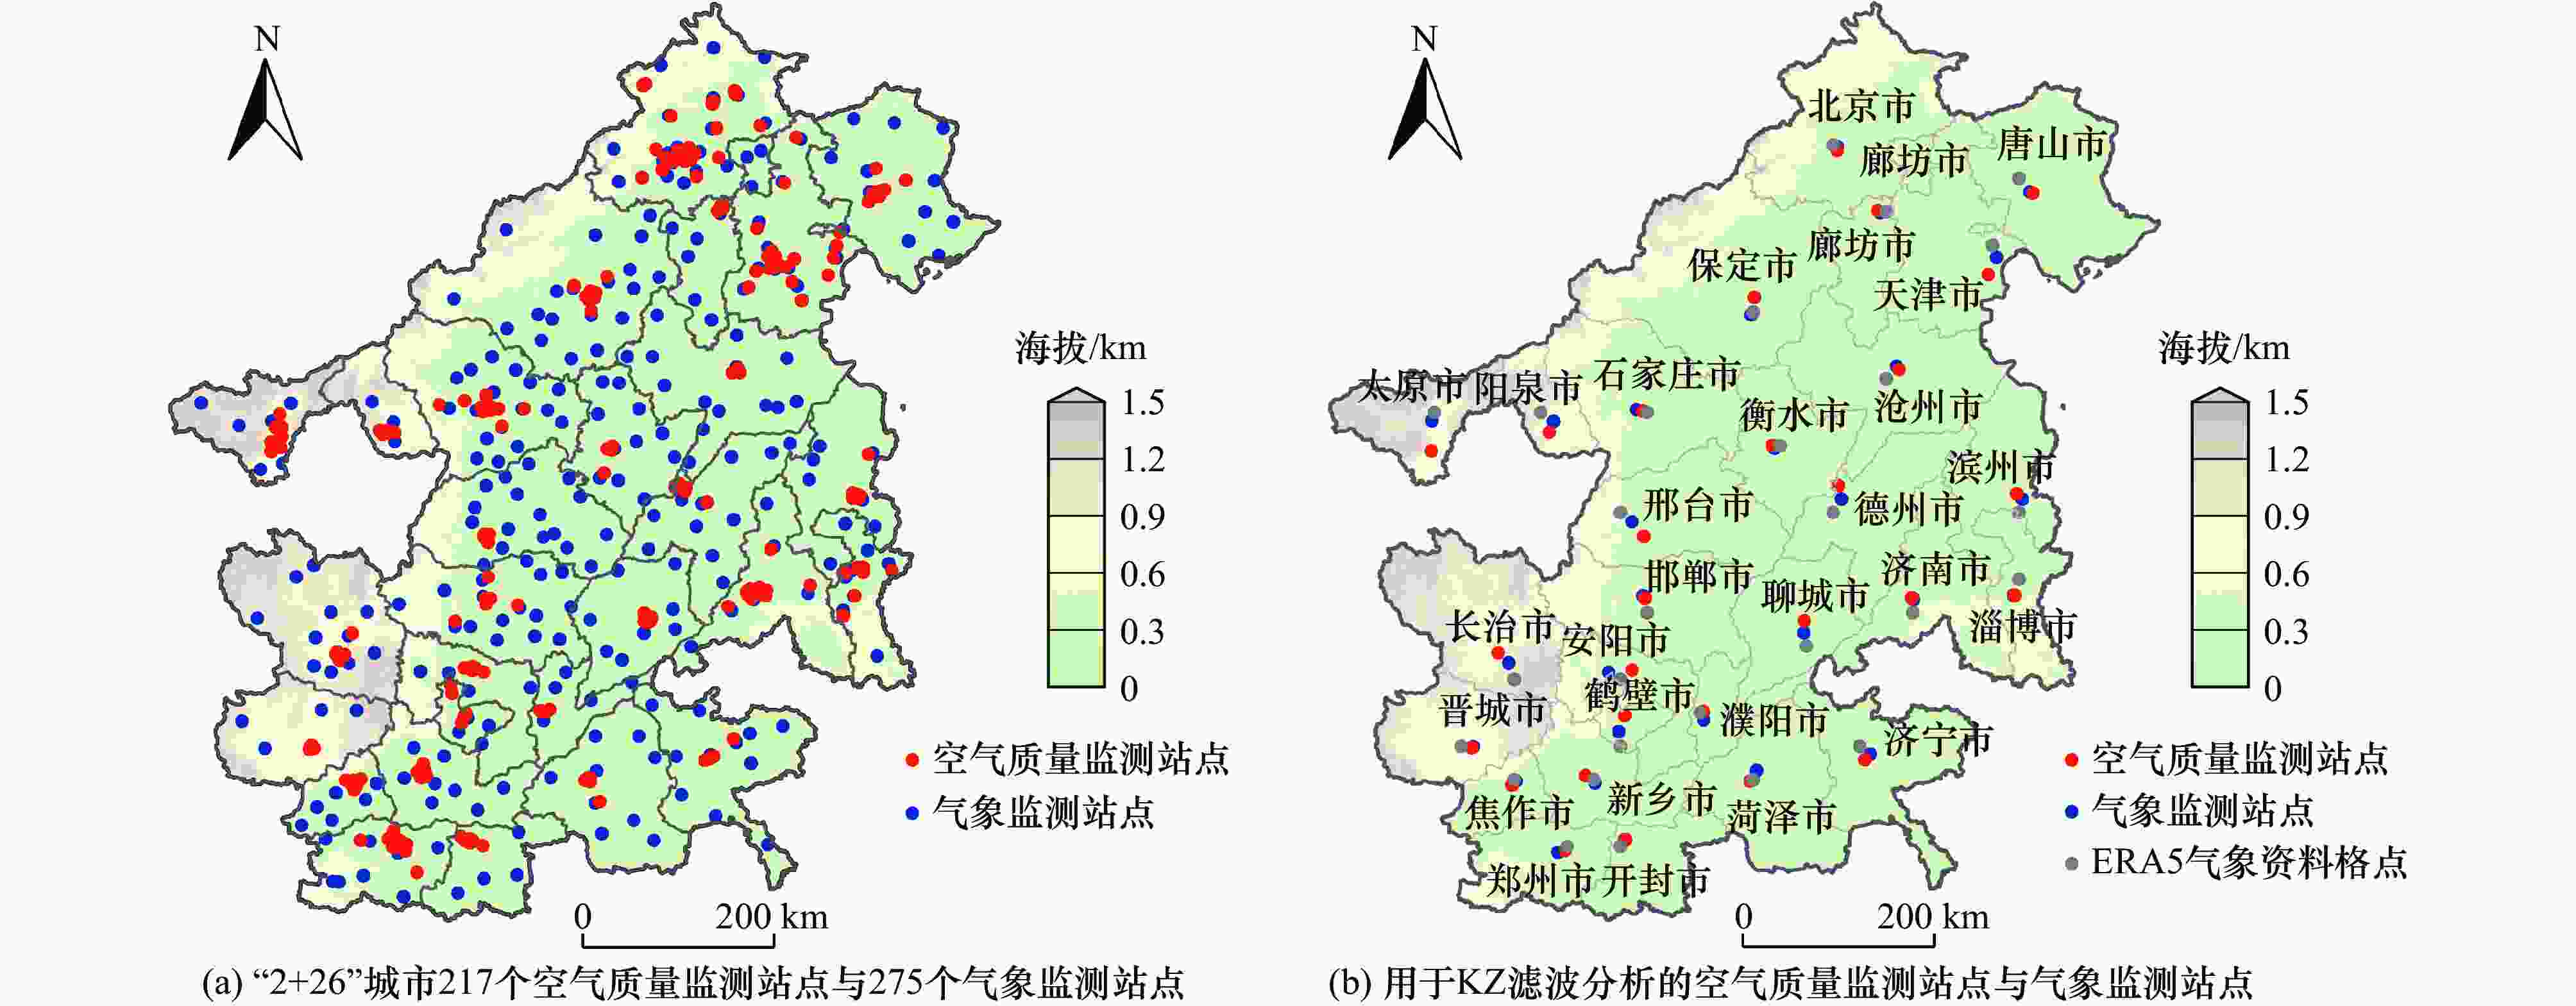
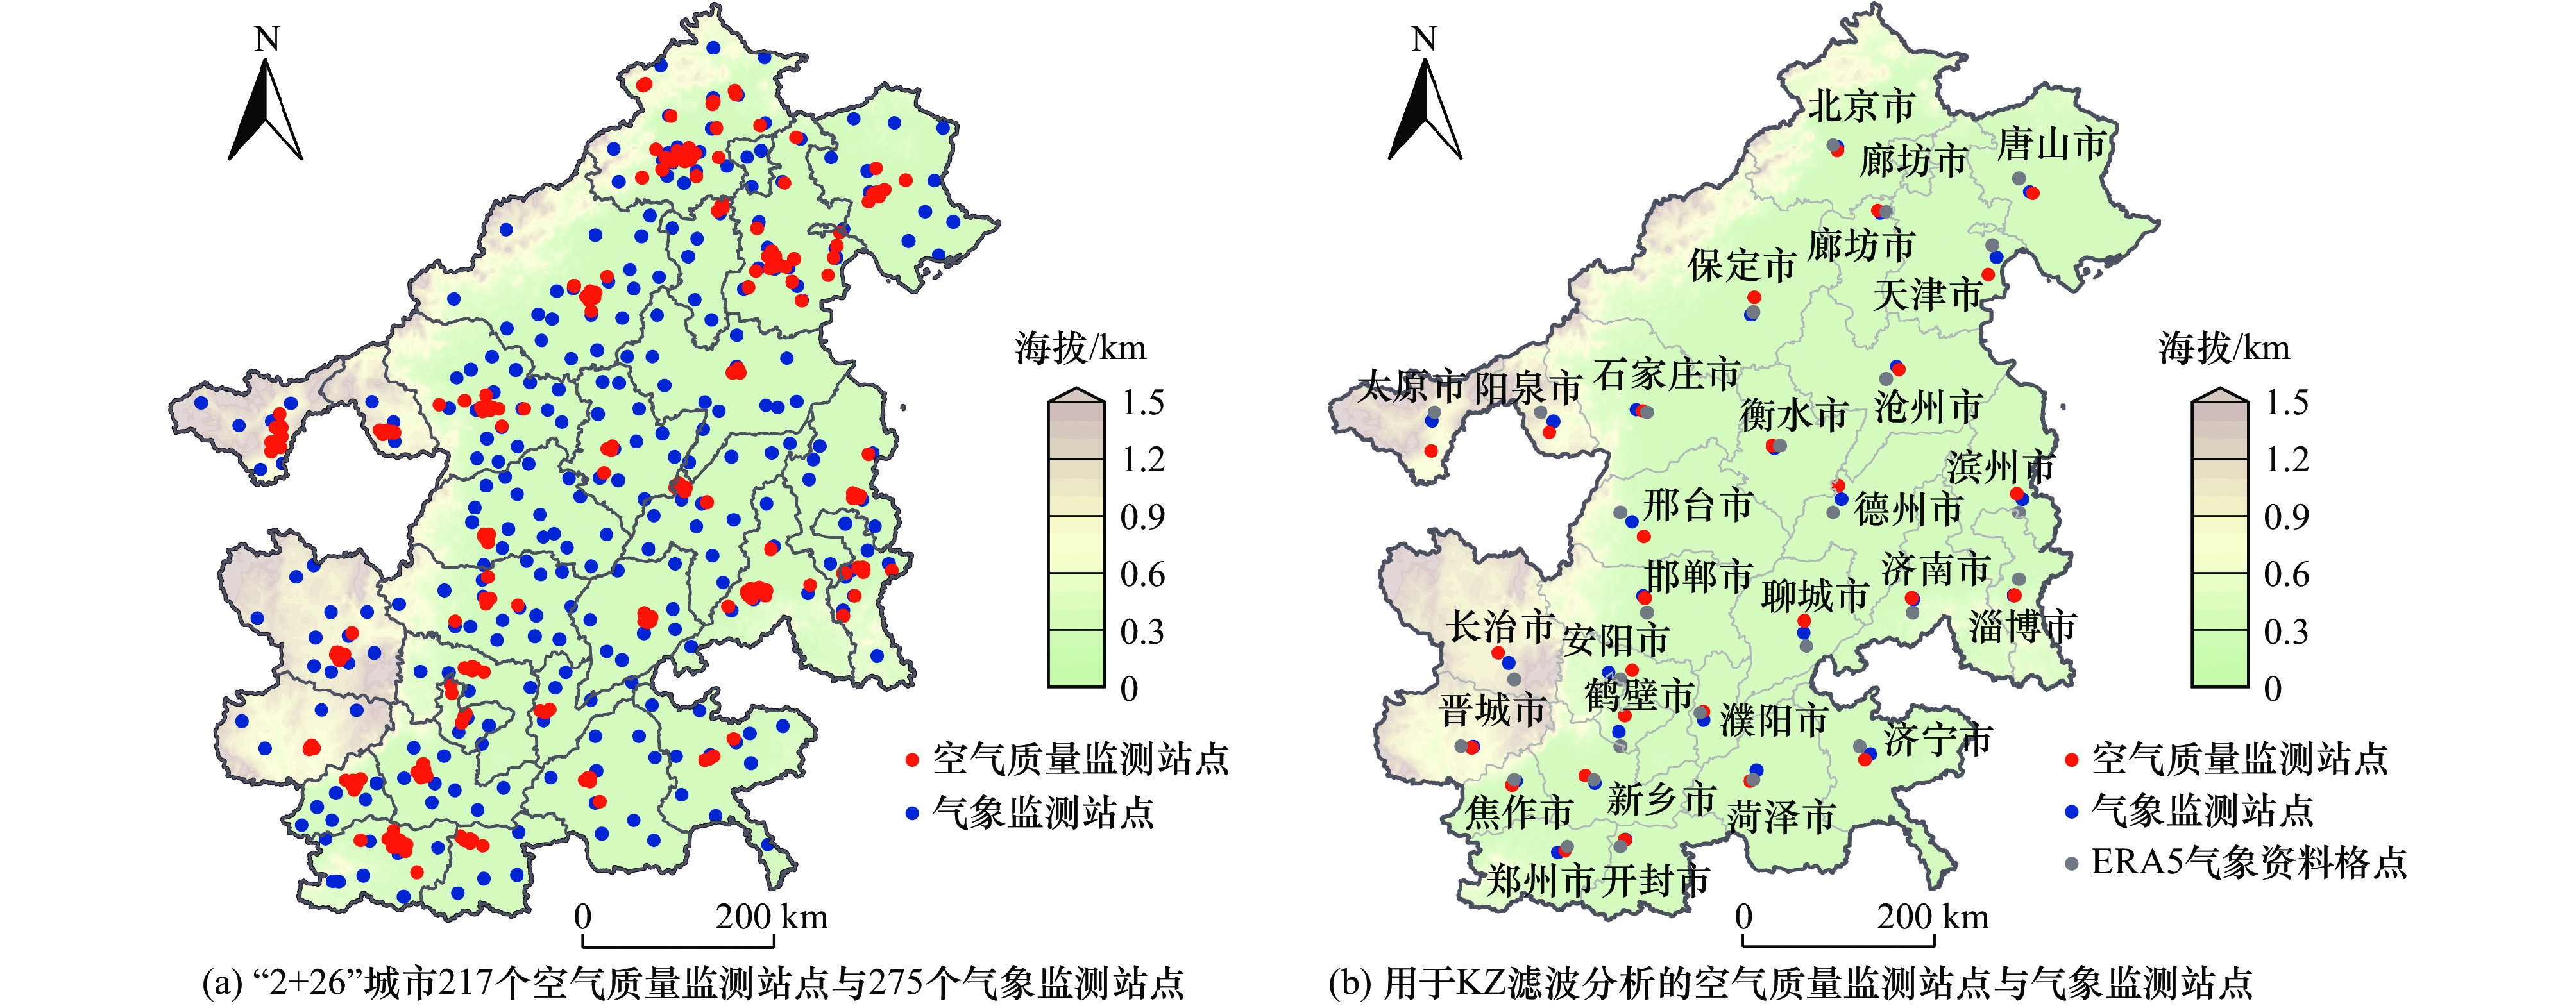
图 1 “2+26”城市空气质量监测站点与气象监测站点分布
Figure 1. Spatial distribution of air quality monitoring sites and meteorological monitoring sites in ‘2+26’ cities
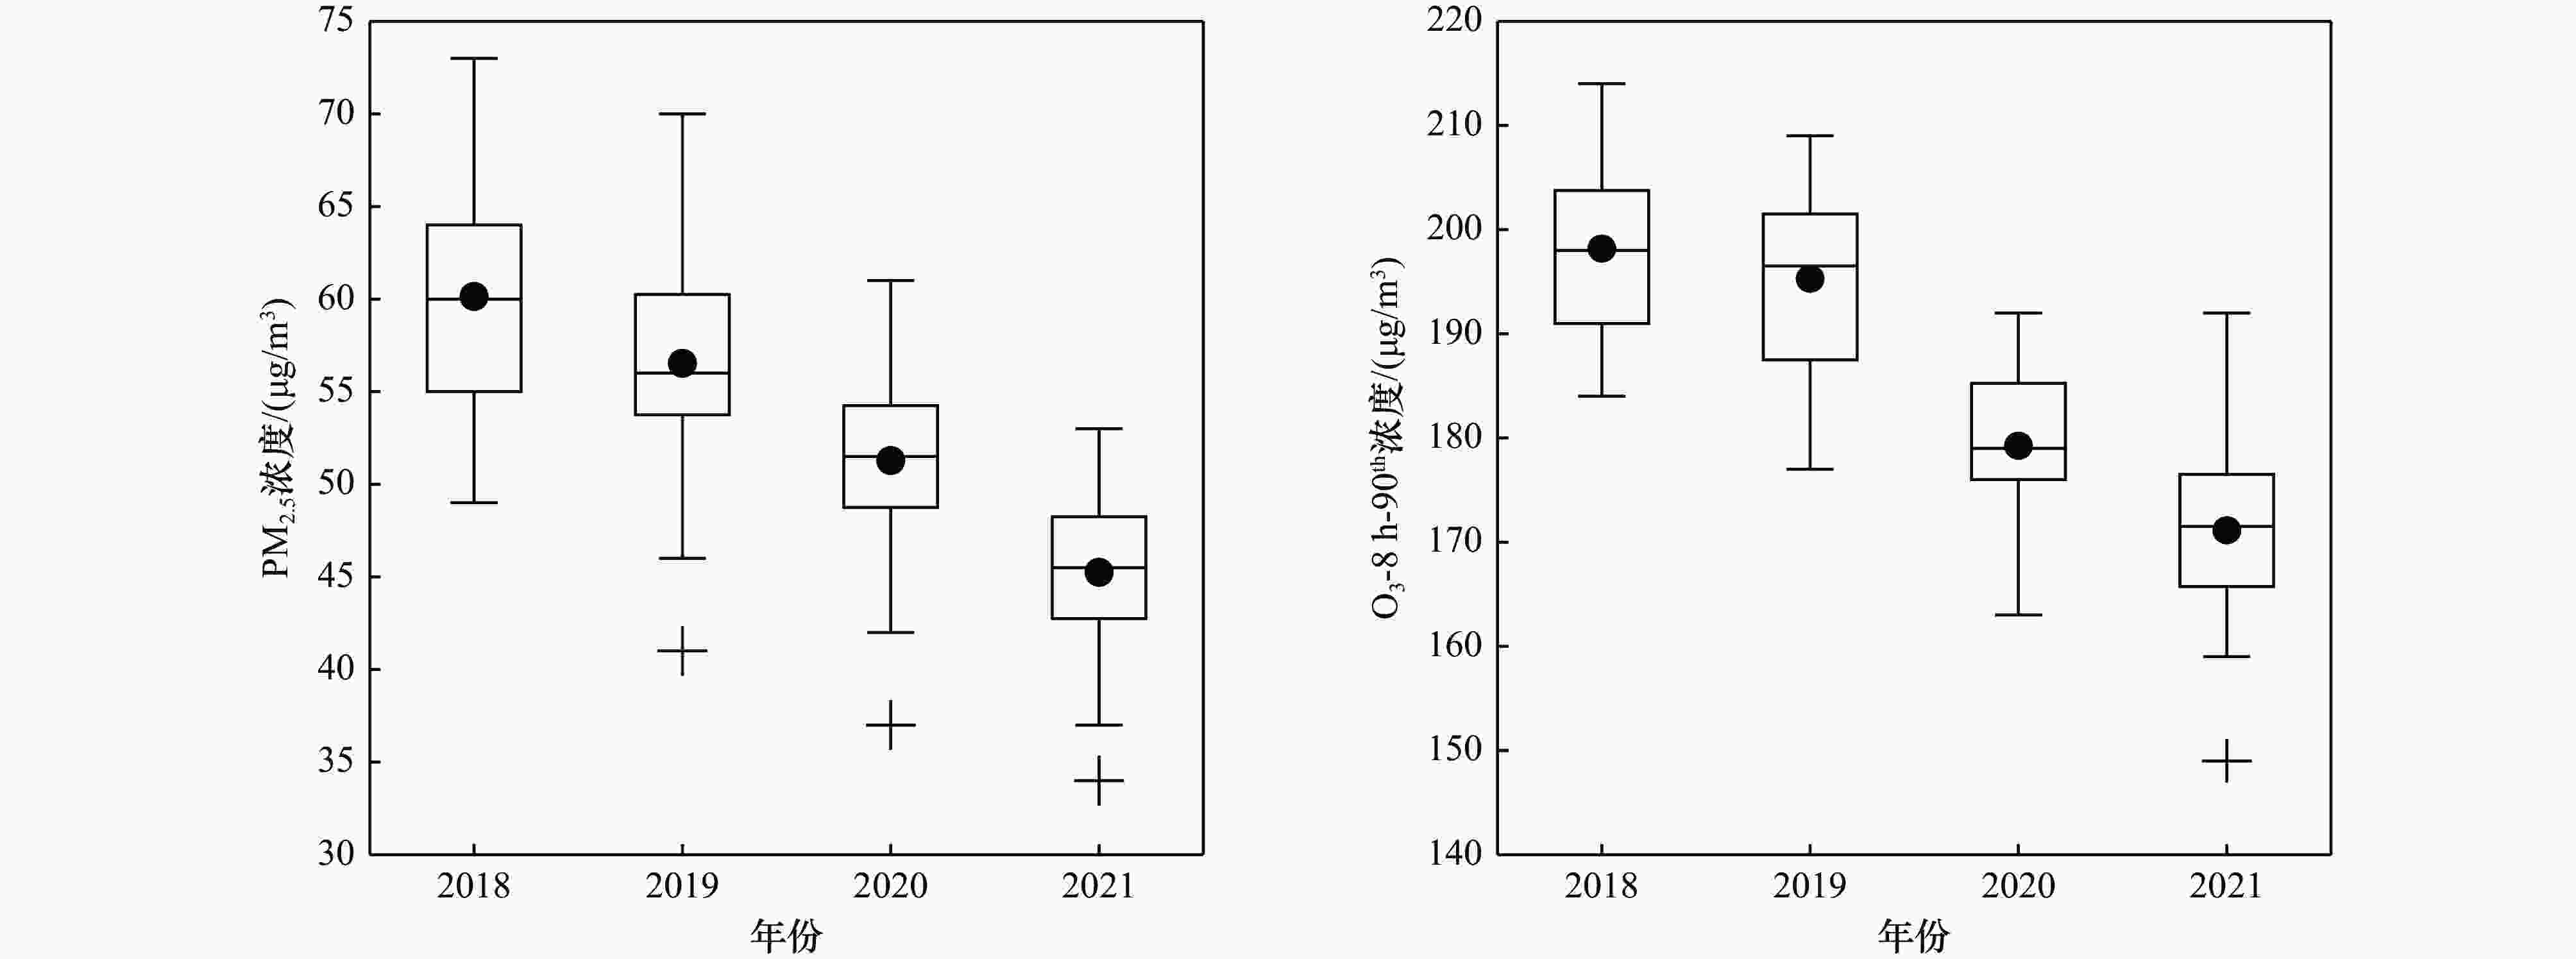
图 2 2018—2021年“2+26”城市PM2.5浓度与O3-8 h-90th浓度的年际变化
Figure 2. Inter-annual variation of PM2.5 and O3-8 h-90th concentrations in ‘2+26’ cities from 2018 to 2021
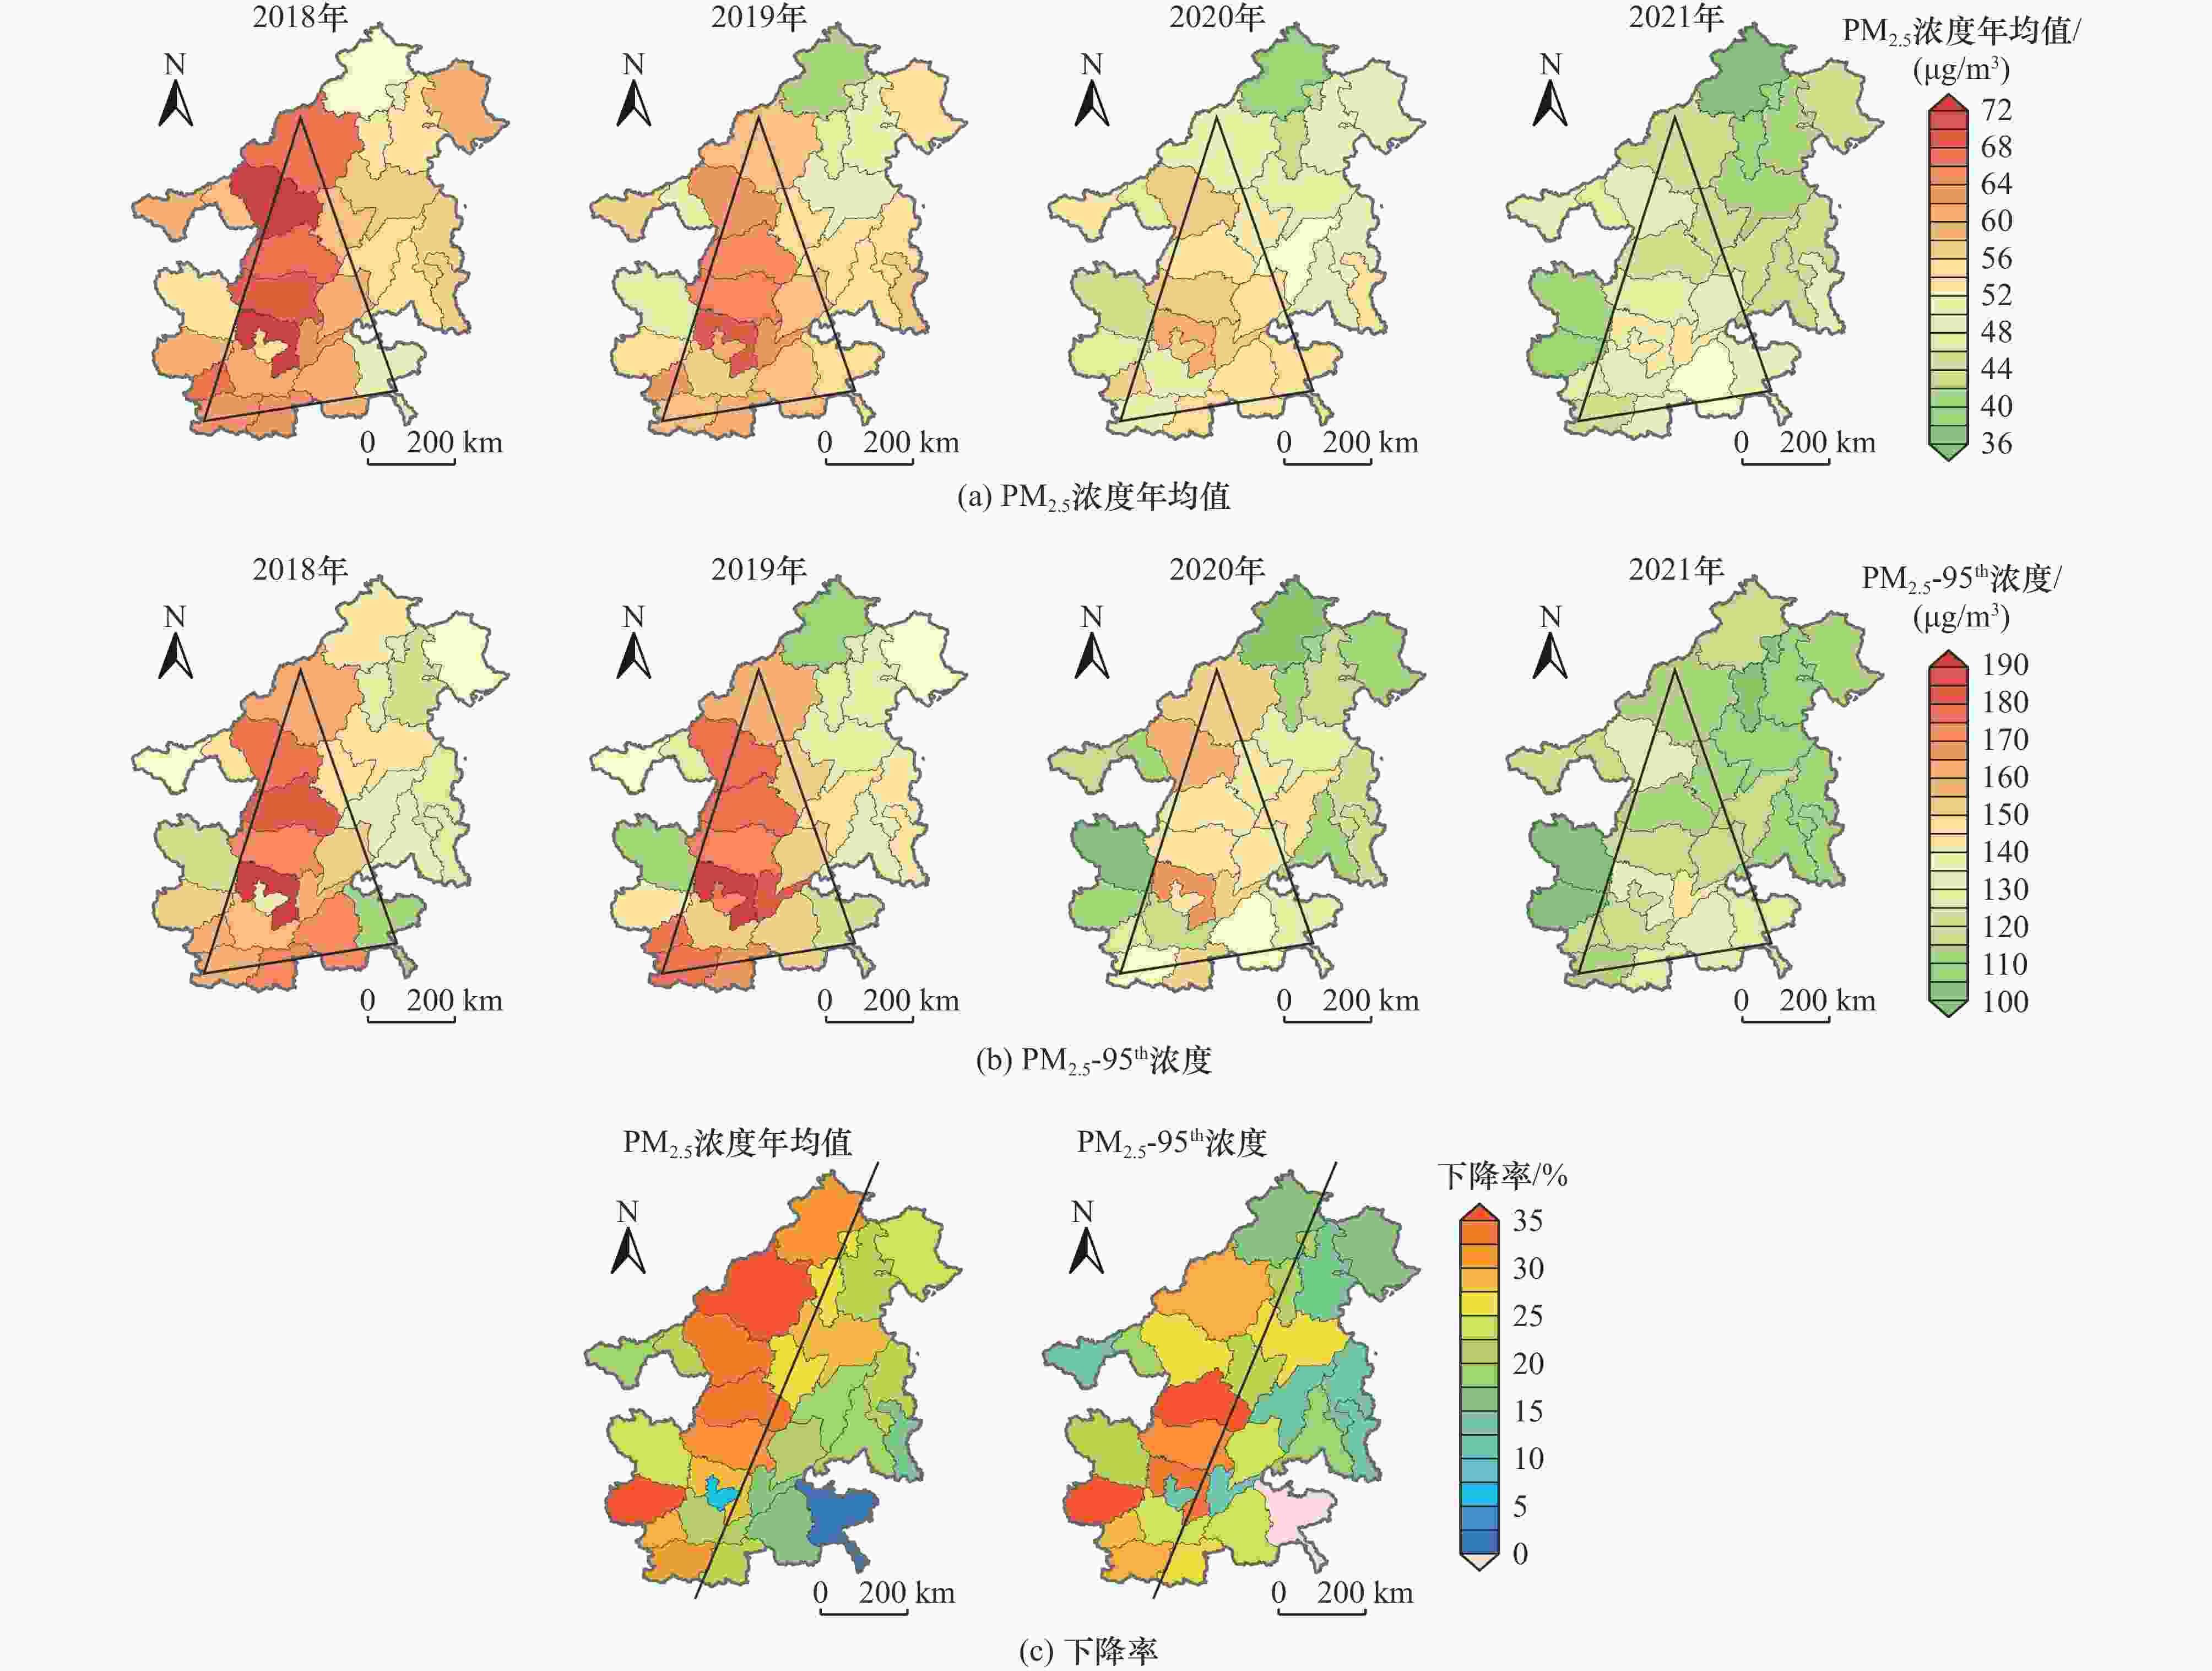
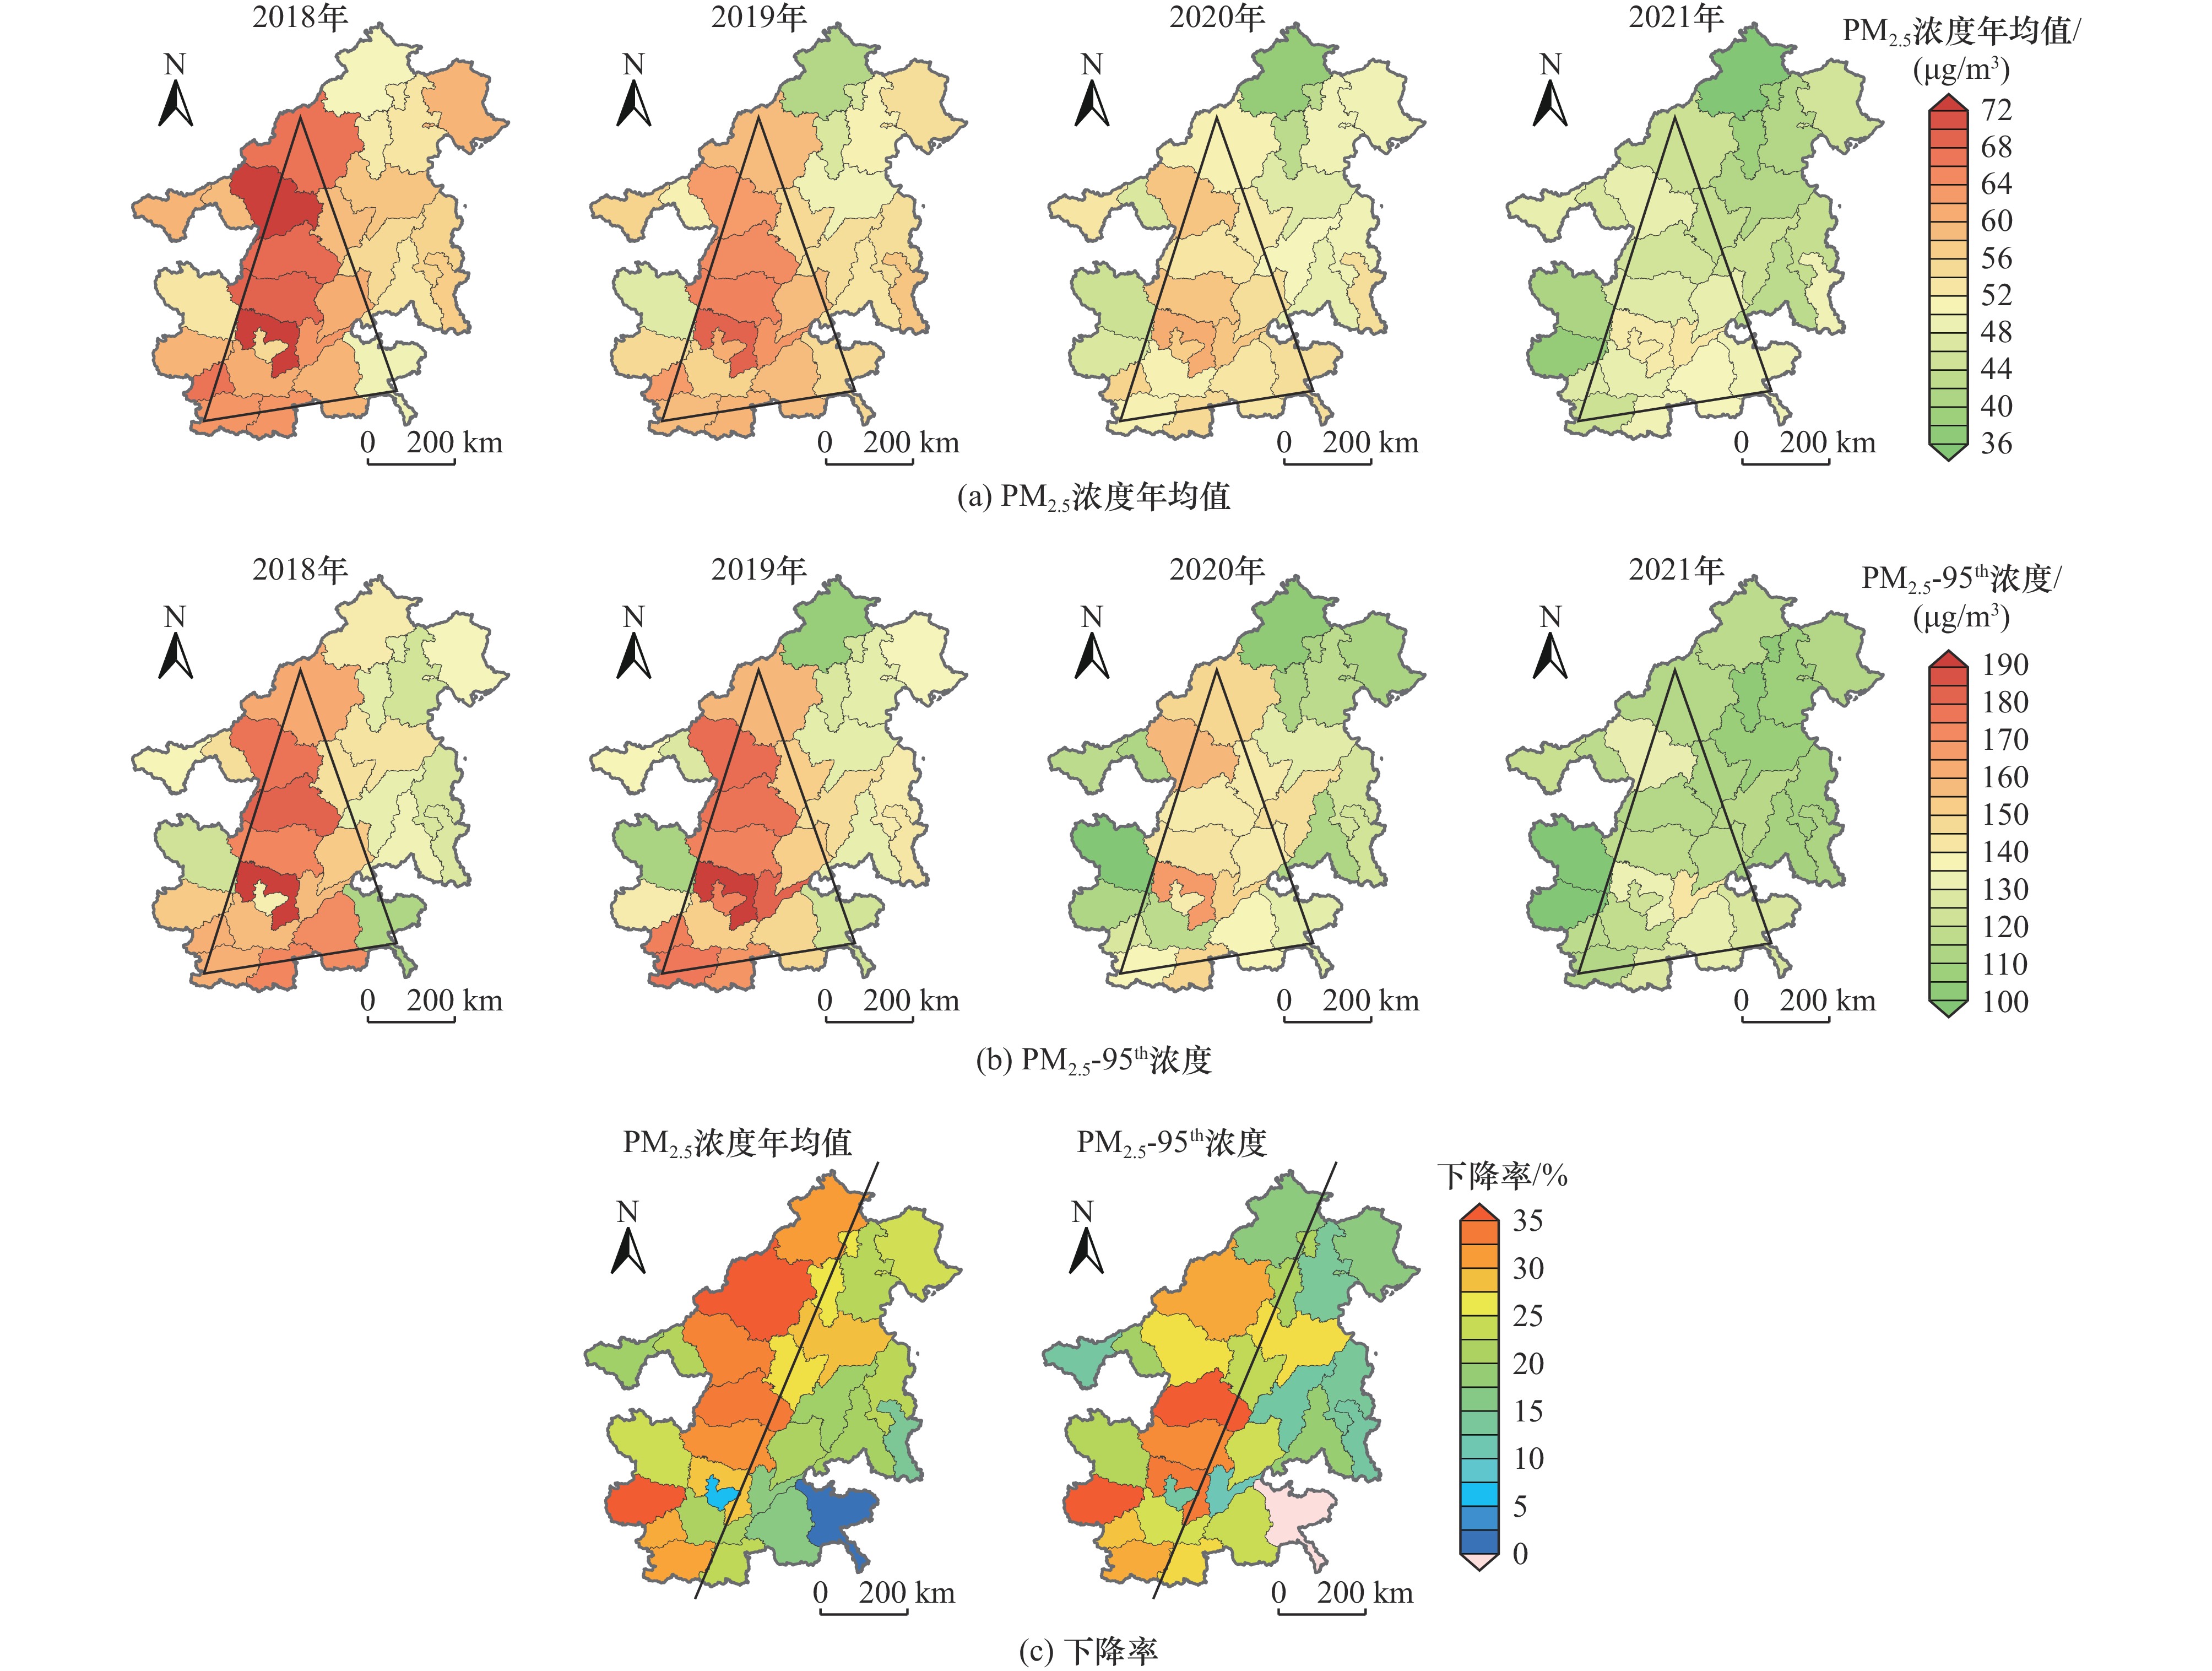
图 3 2018—2021年“2+26”城市PM2.5浓度及其相对变化
注:图a、b中三角形区域包含了河北省南部、河南省与山东省南部,该区域污染比较严重. 图c中斜线将“2+26”城市分为区域西北部与东南部,2个区域PM2.5浓度下降率不同.
Figure 3. The concentration and its relative variation of PM2.5 in ‘2+26’ cities from 2018 to 2021
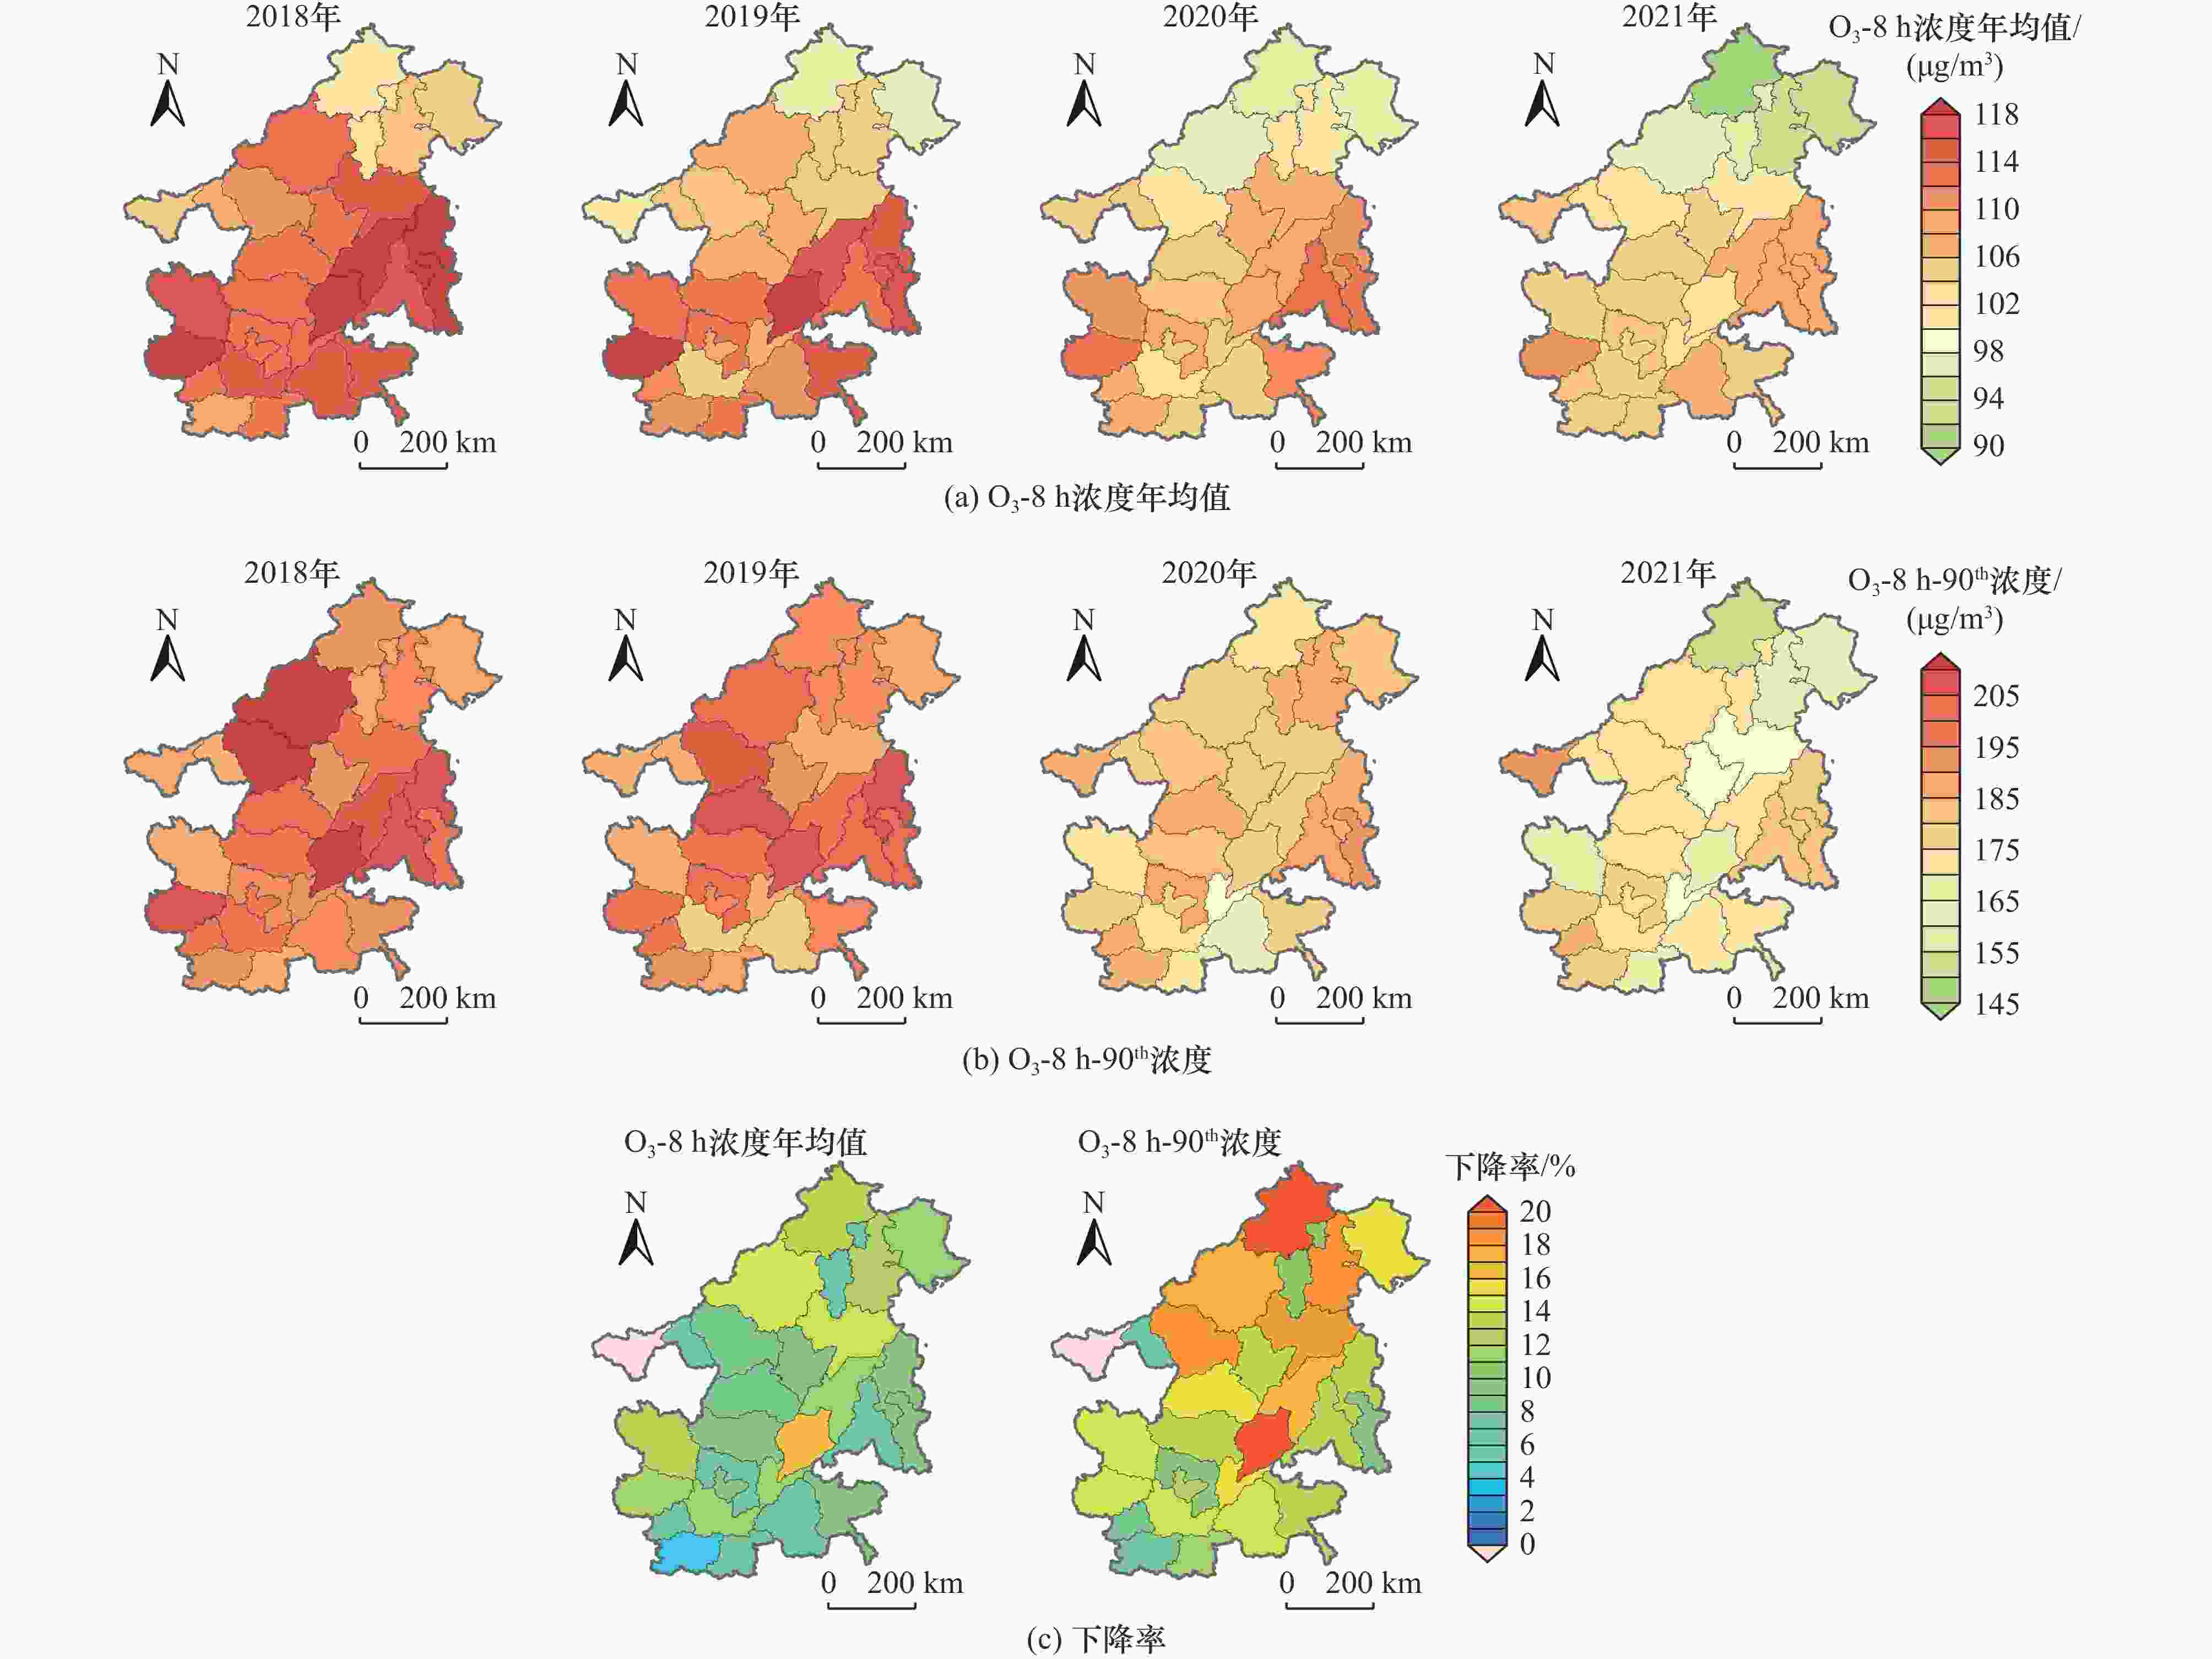
图 4 2018—2021年“2+26”城市O3-8 h浓度及其相对变化
Figure 4. The concentration and its relative variation of O3-8 h in ‘2+26’ cities from 2018 to 2021

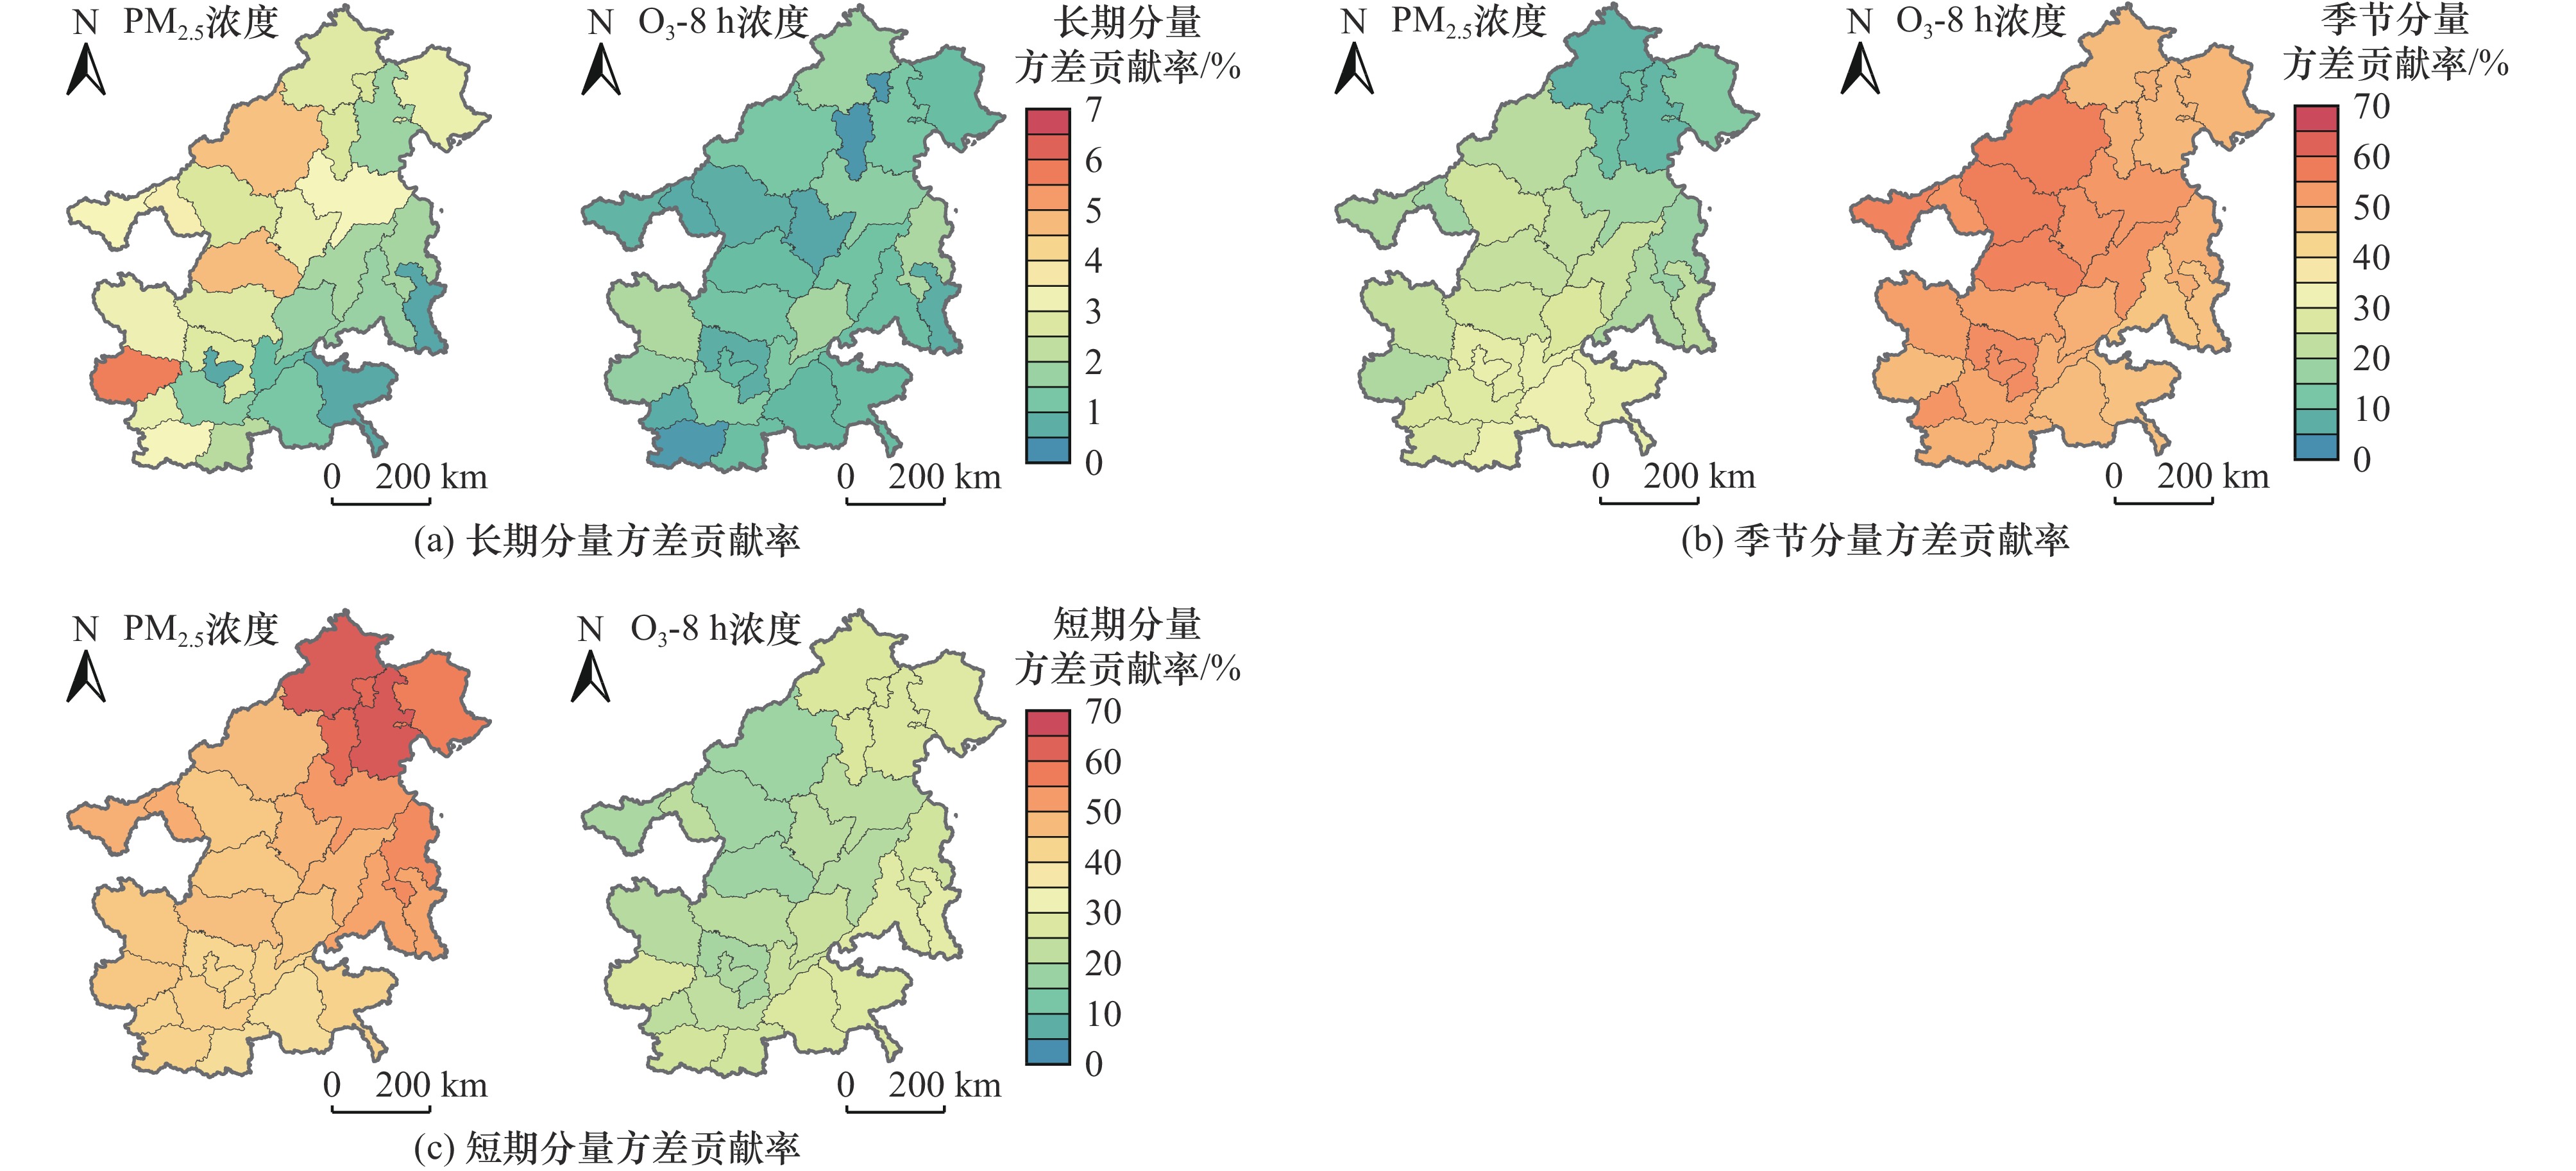
图 5 2018—2021年“2+26”城市PM2.5与O3-8 h浓度各分量的方差贡献率
Figure 5. Variance contribution of each component to PM2.5 and O3-8 h concentrations in ‘2+26’ cities from 2018 to 2021
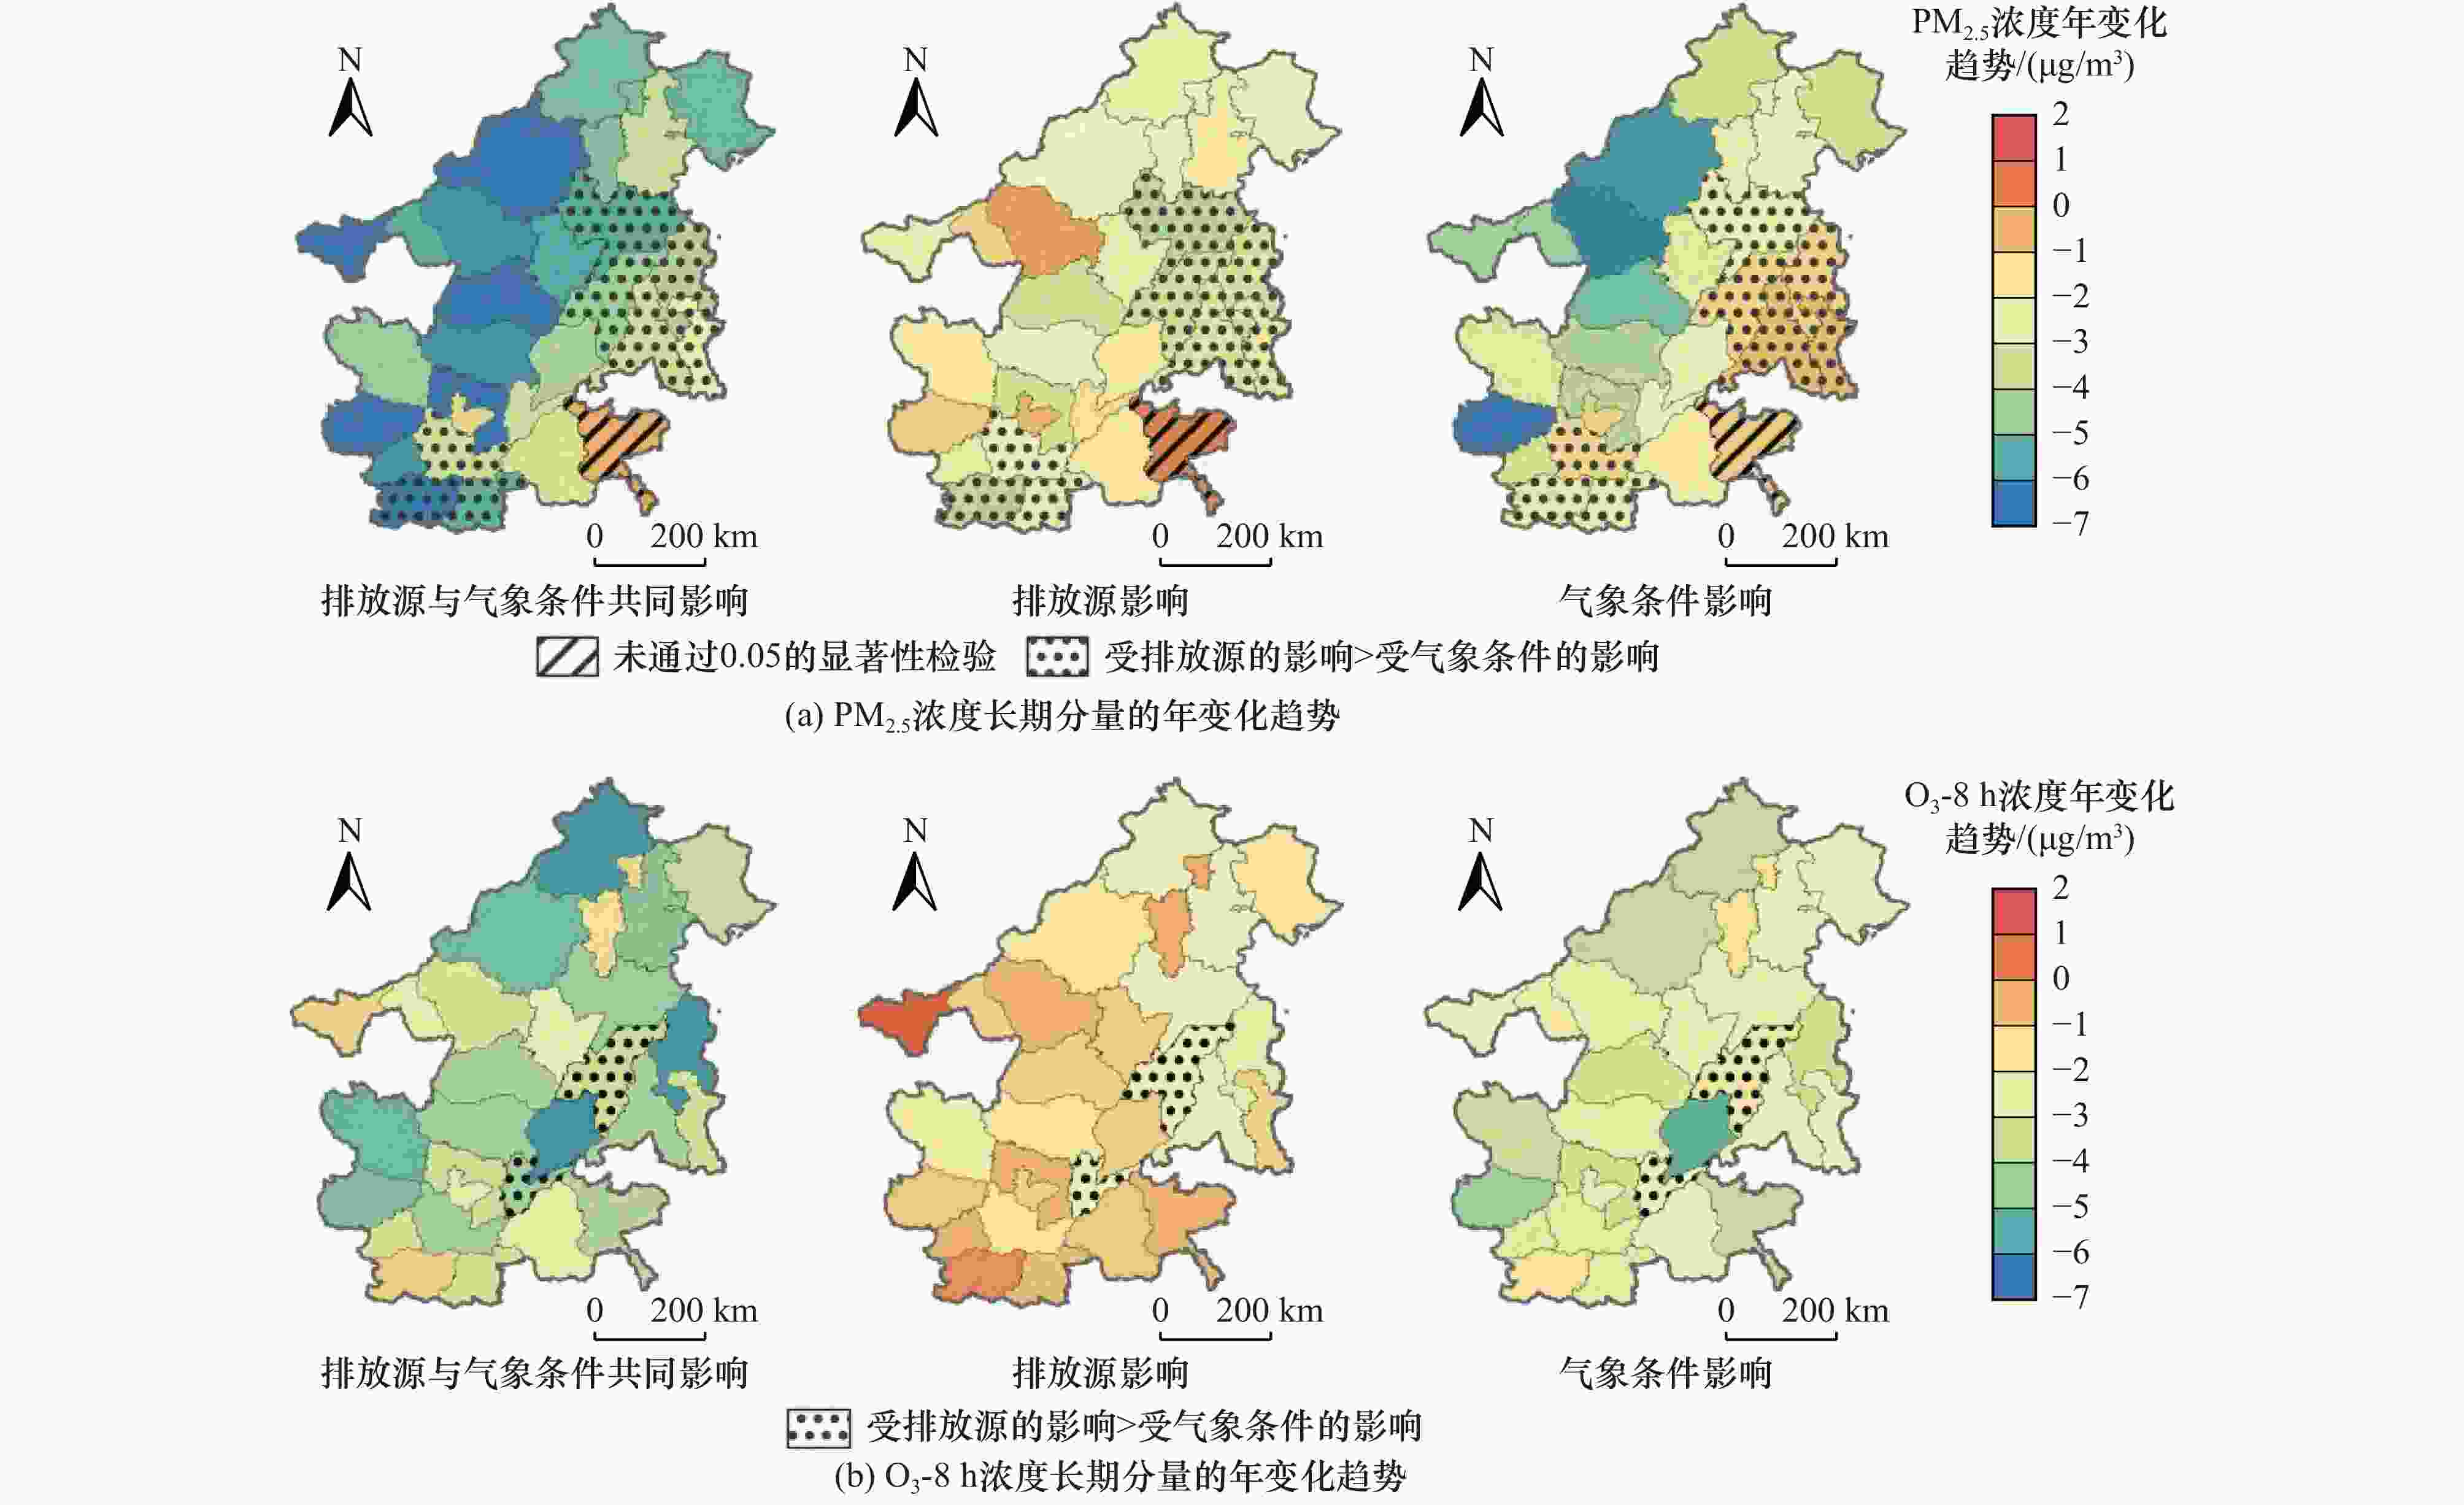
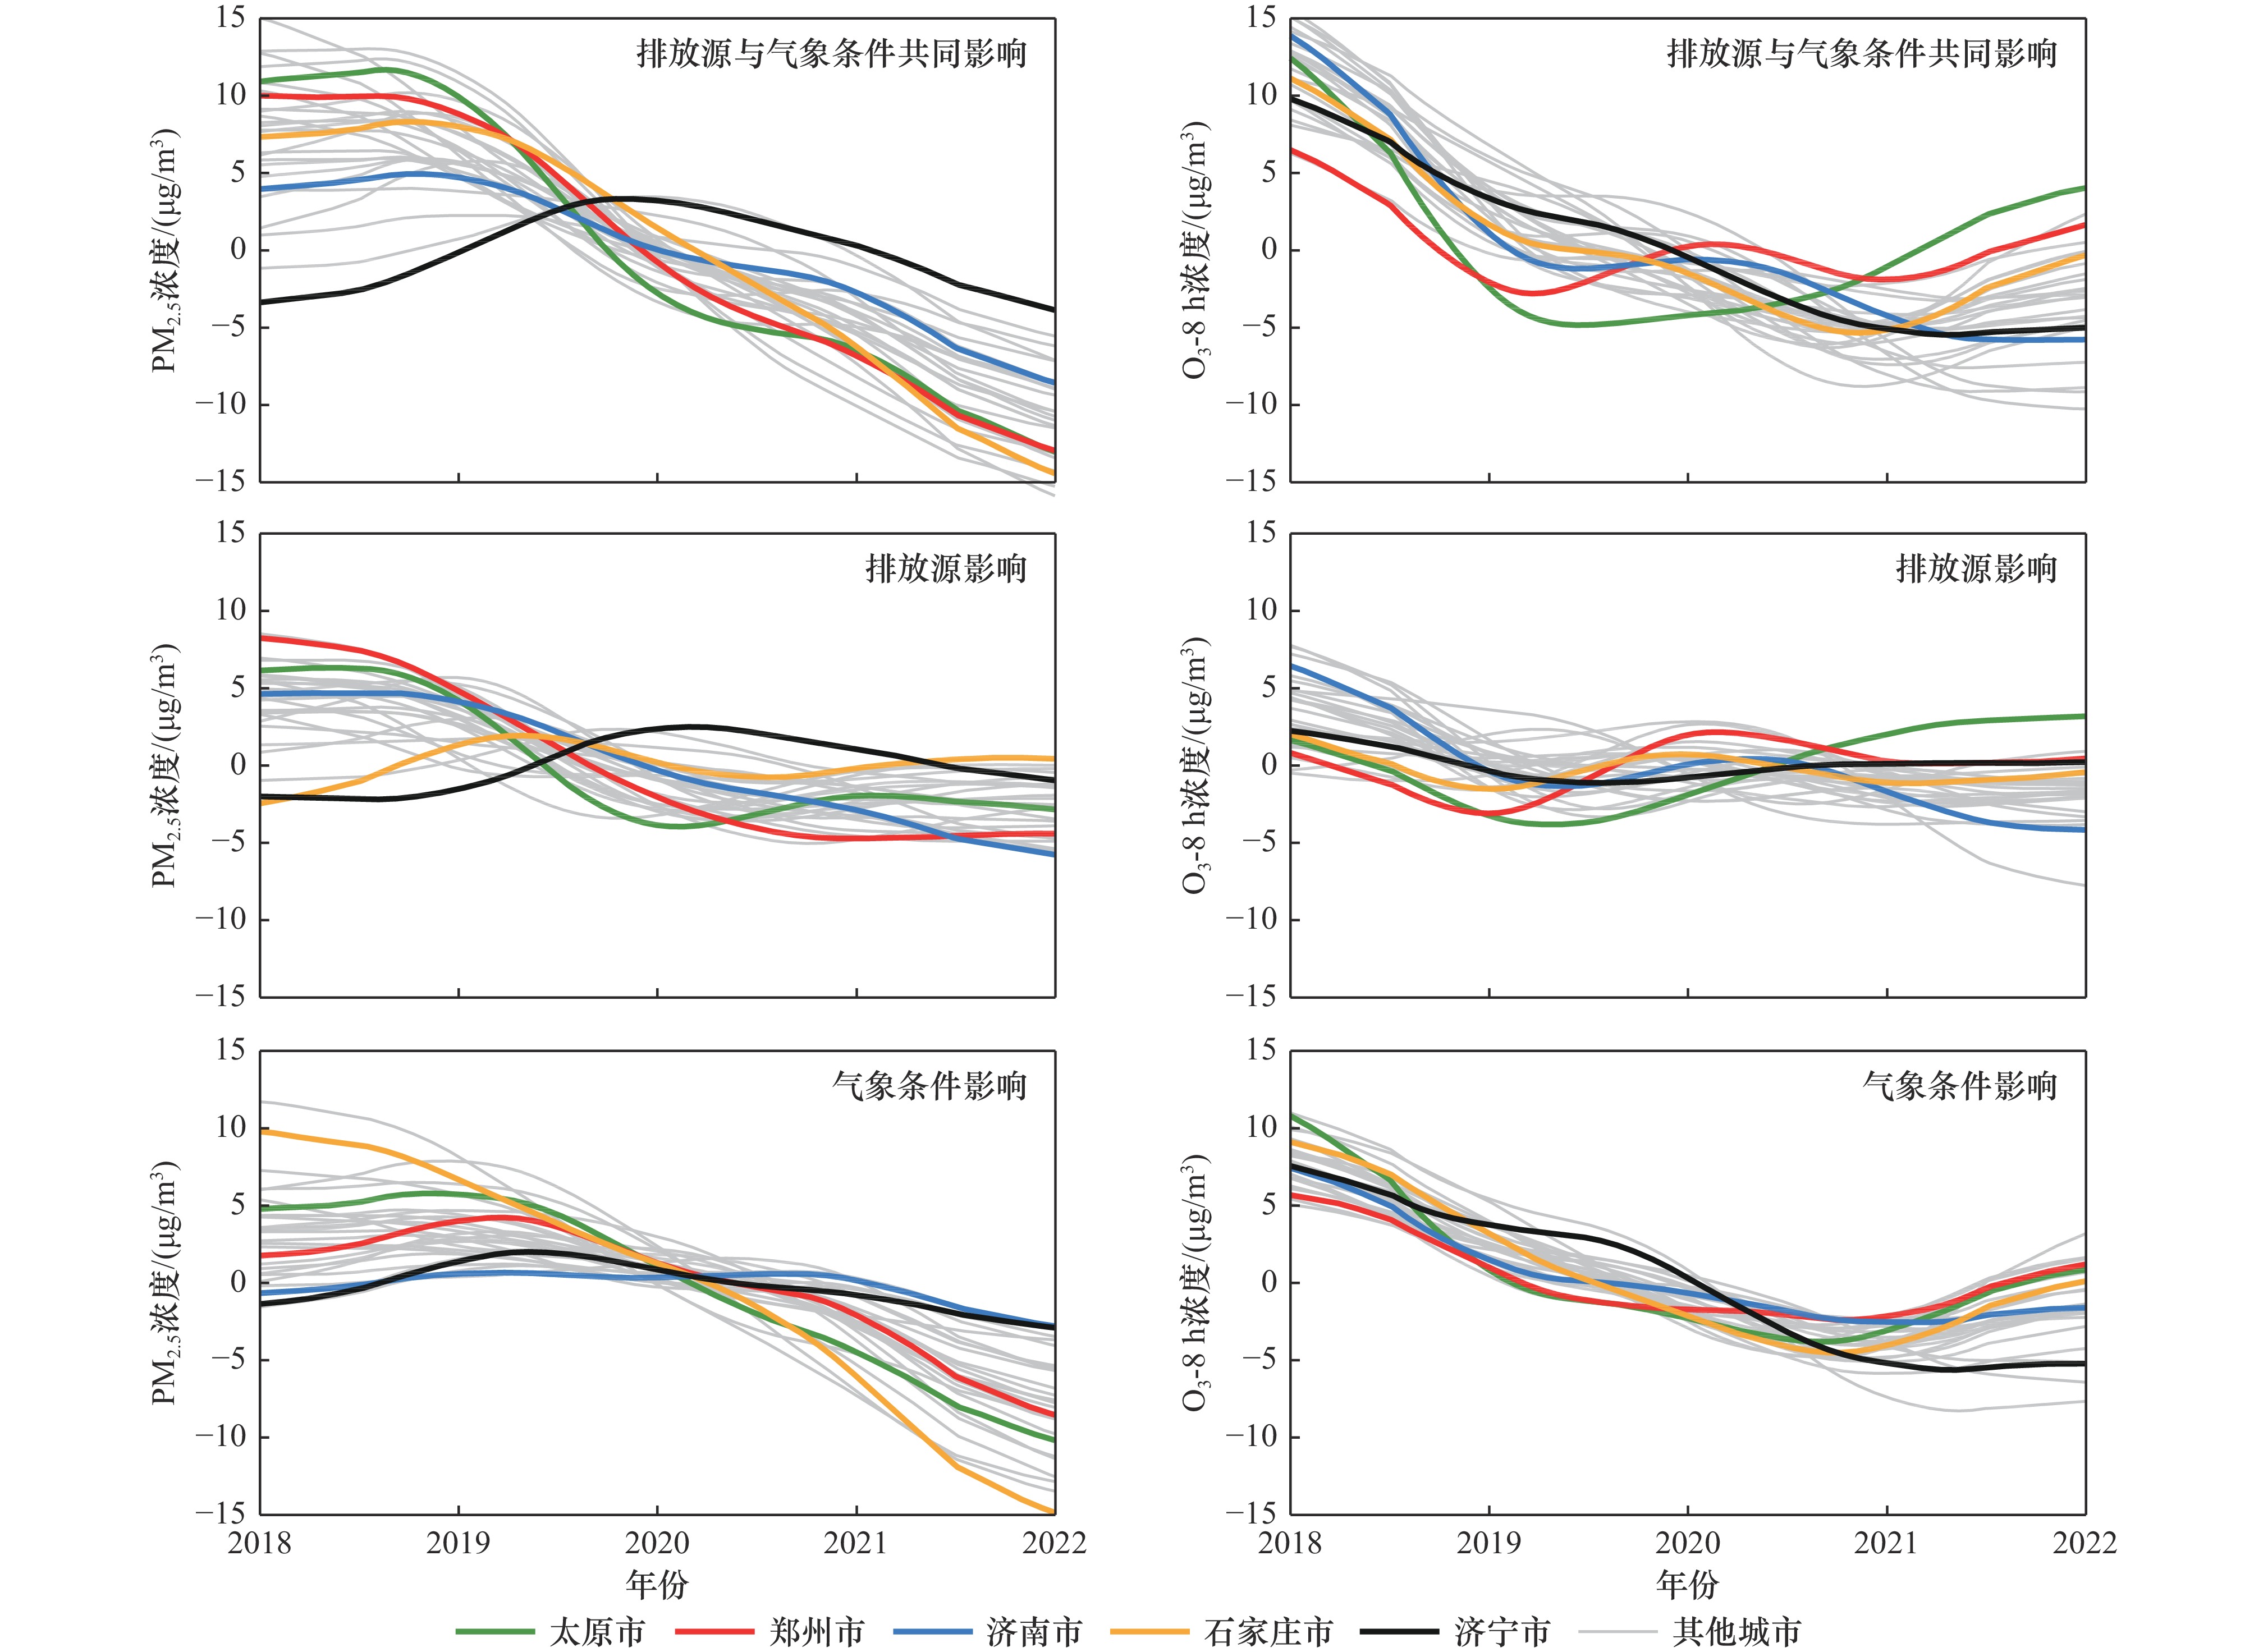
图 6 受排放源与气象条件影响的PM2.5与O3-8 h浓度长期分量的年变化趋势
Figure 6. Long-term annual variation trend of PM2.5 and O3-8 h concentrations influenced by emission sources and meteorology factors
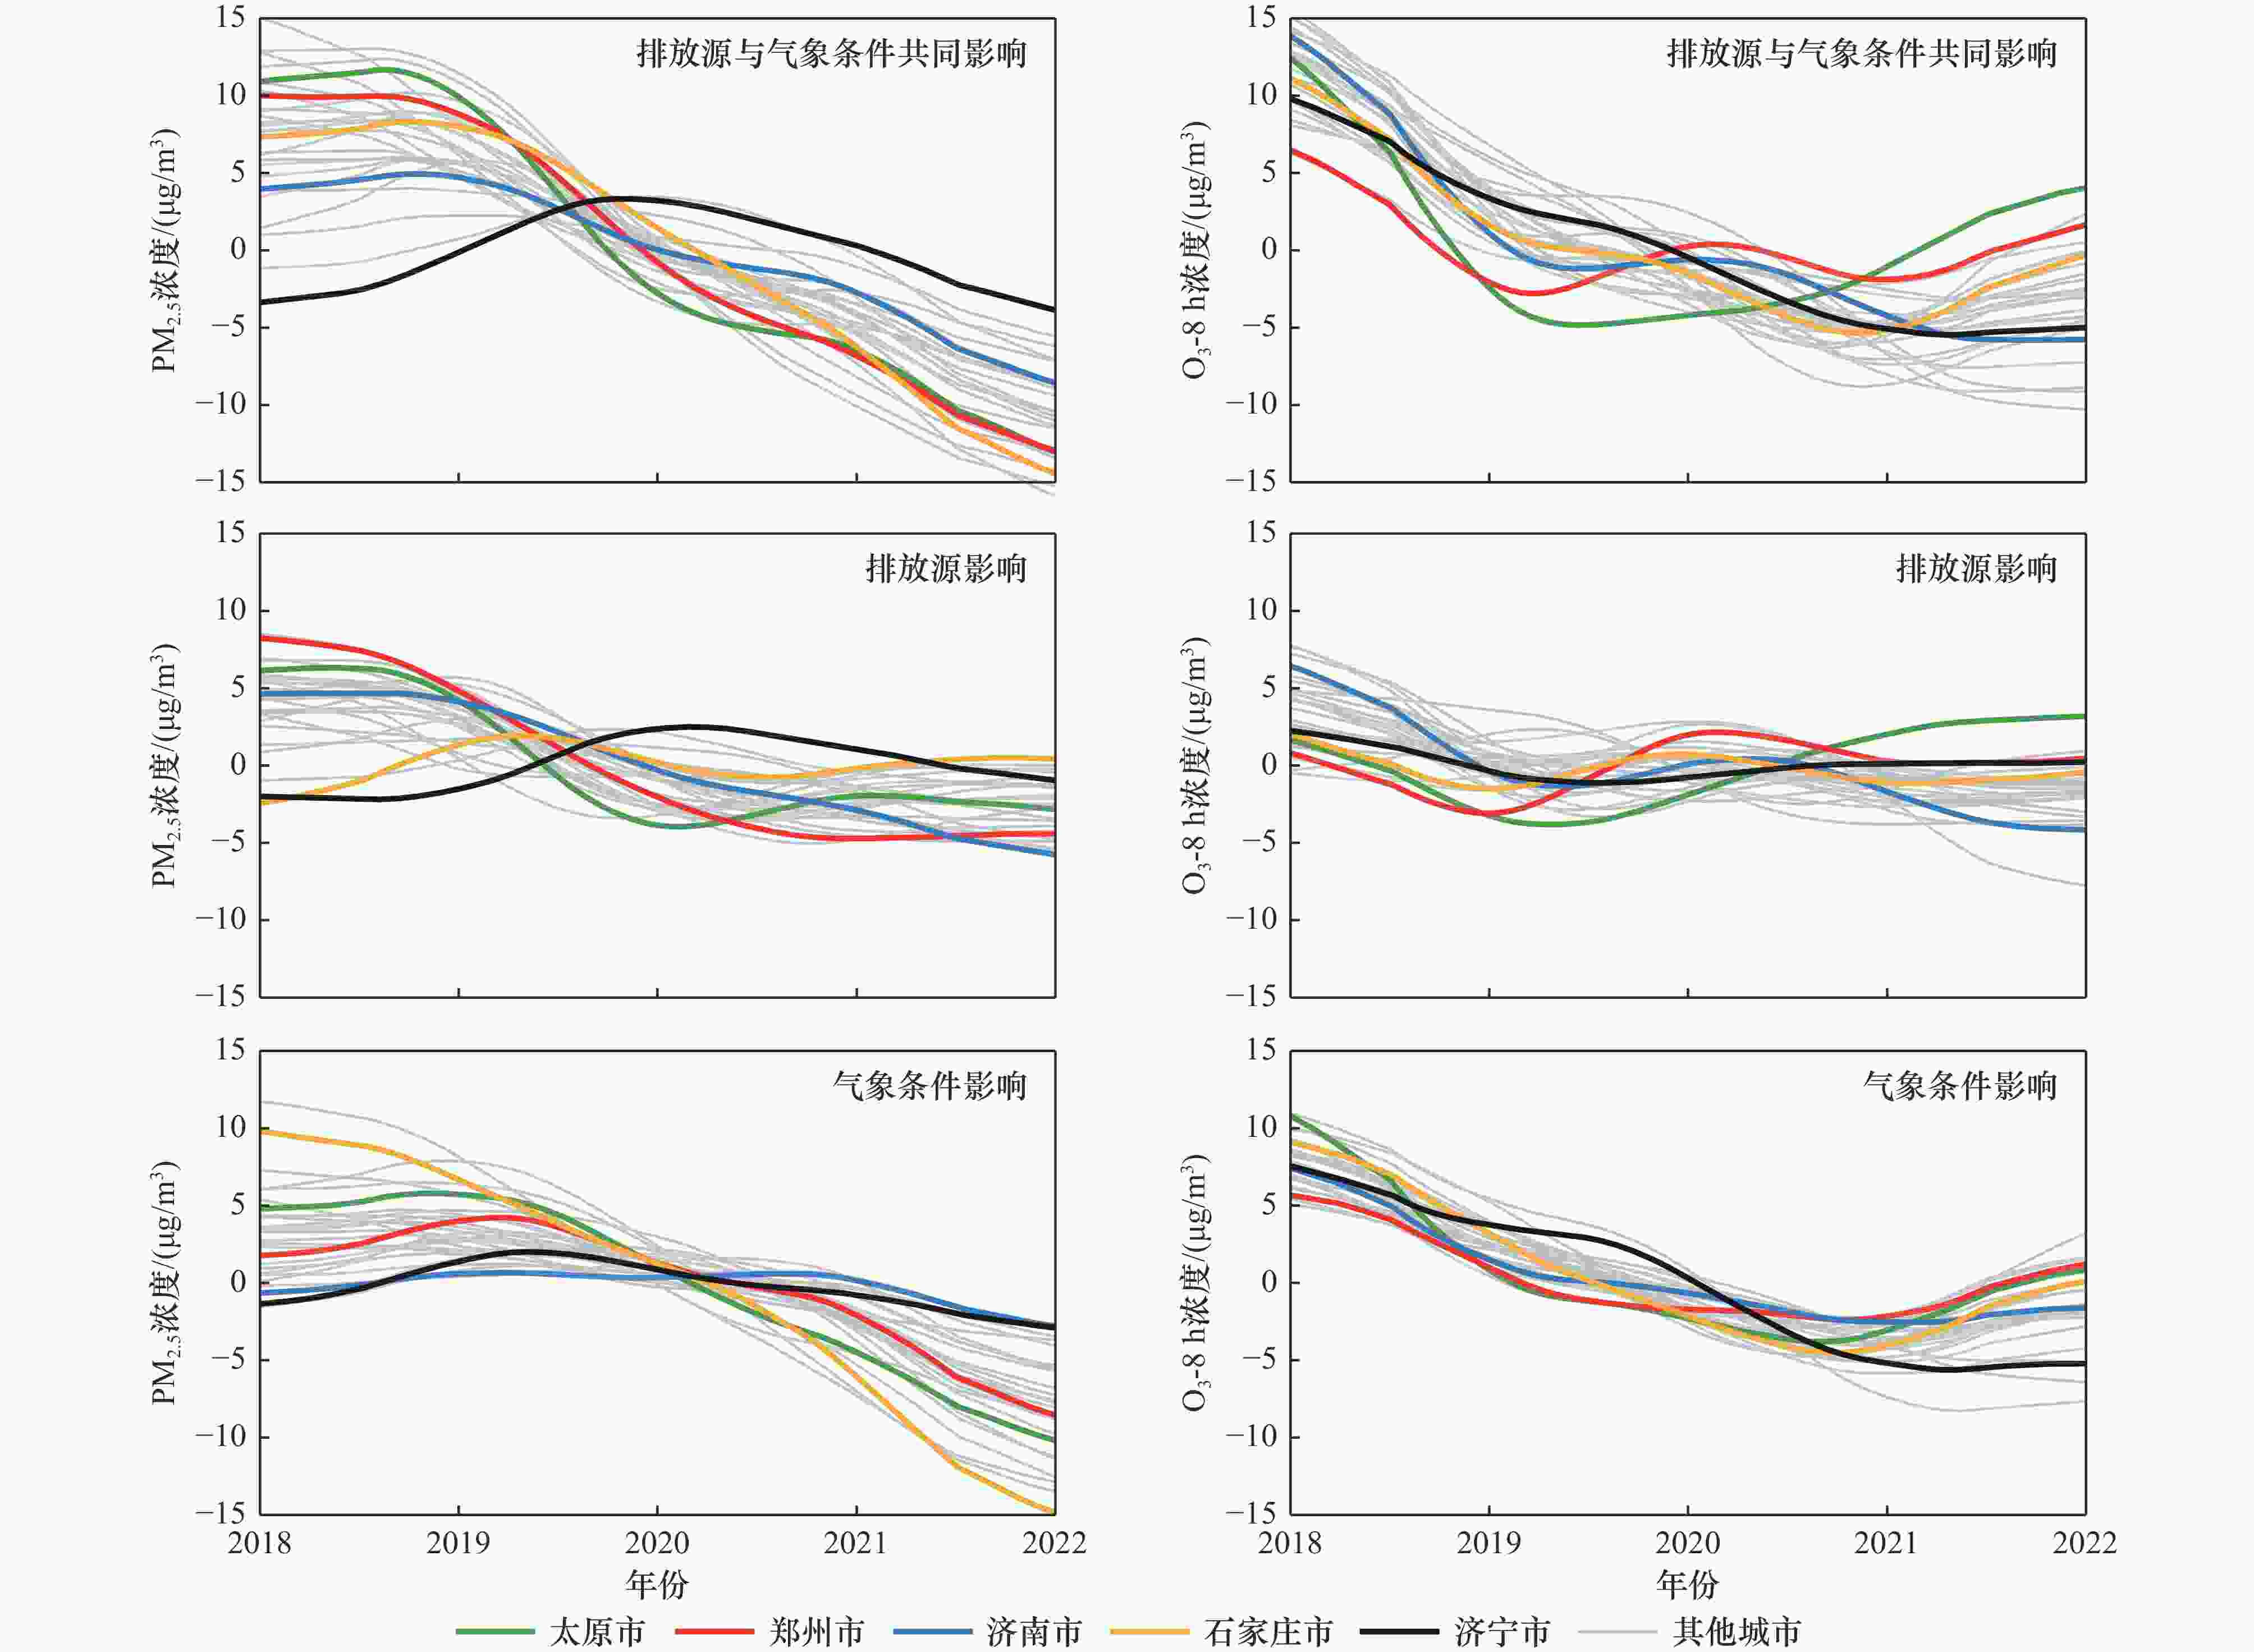
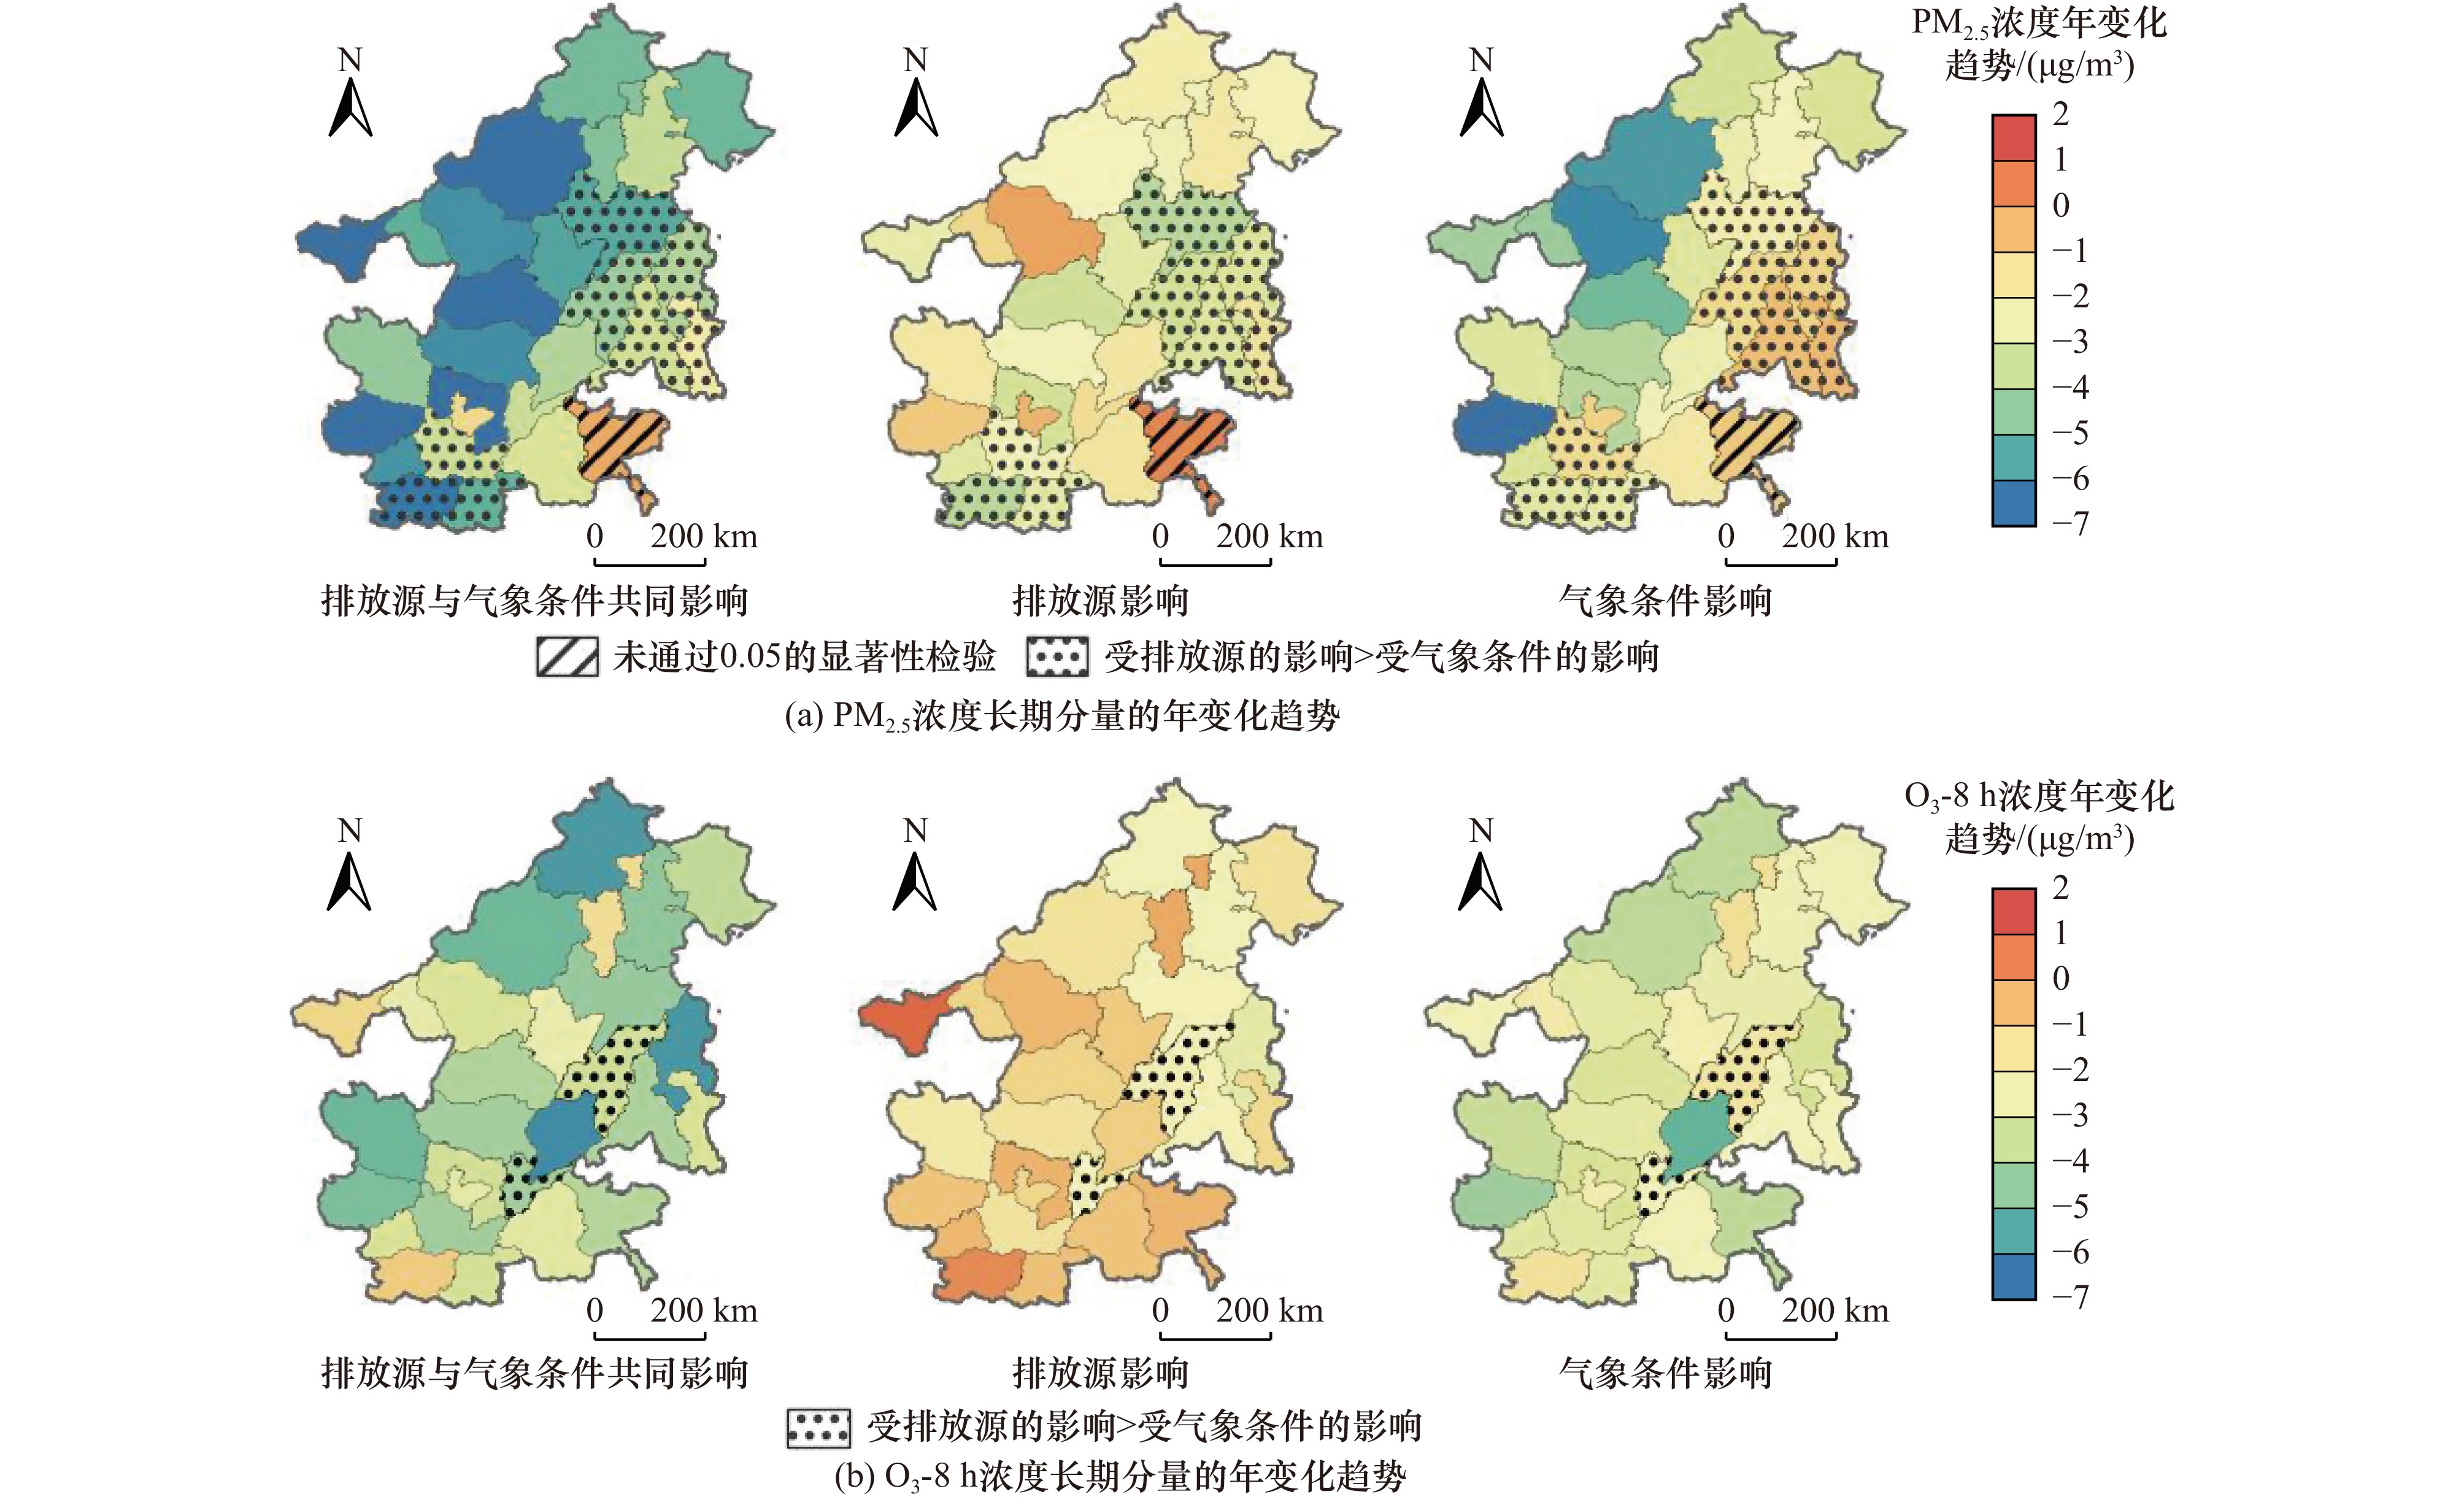
图 7 排放源与气象条件对PM2.5与O3-8 h浓度长期分量趋势的影响
Figure 7. Influence of emission sources and meteorological factors on long-term trend of PM2.5 and O3-8 h concentrations
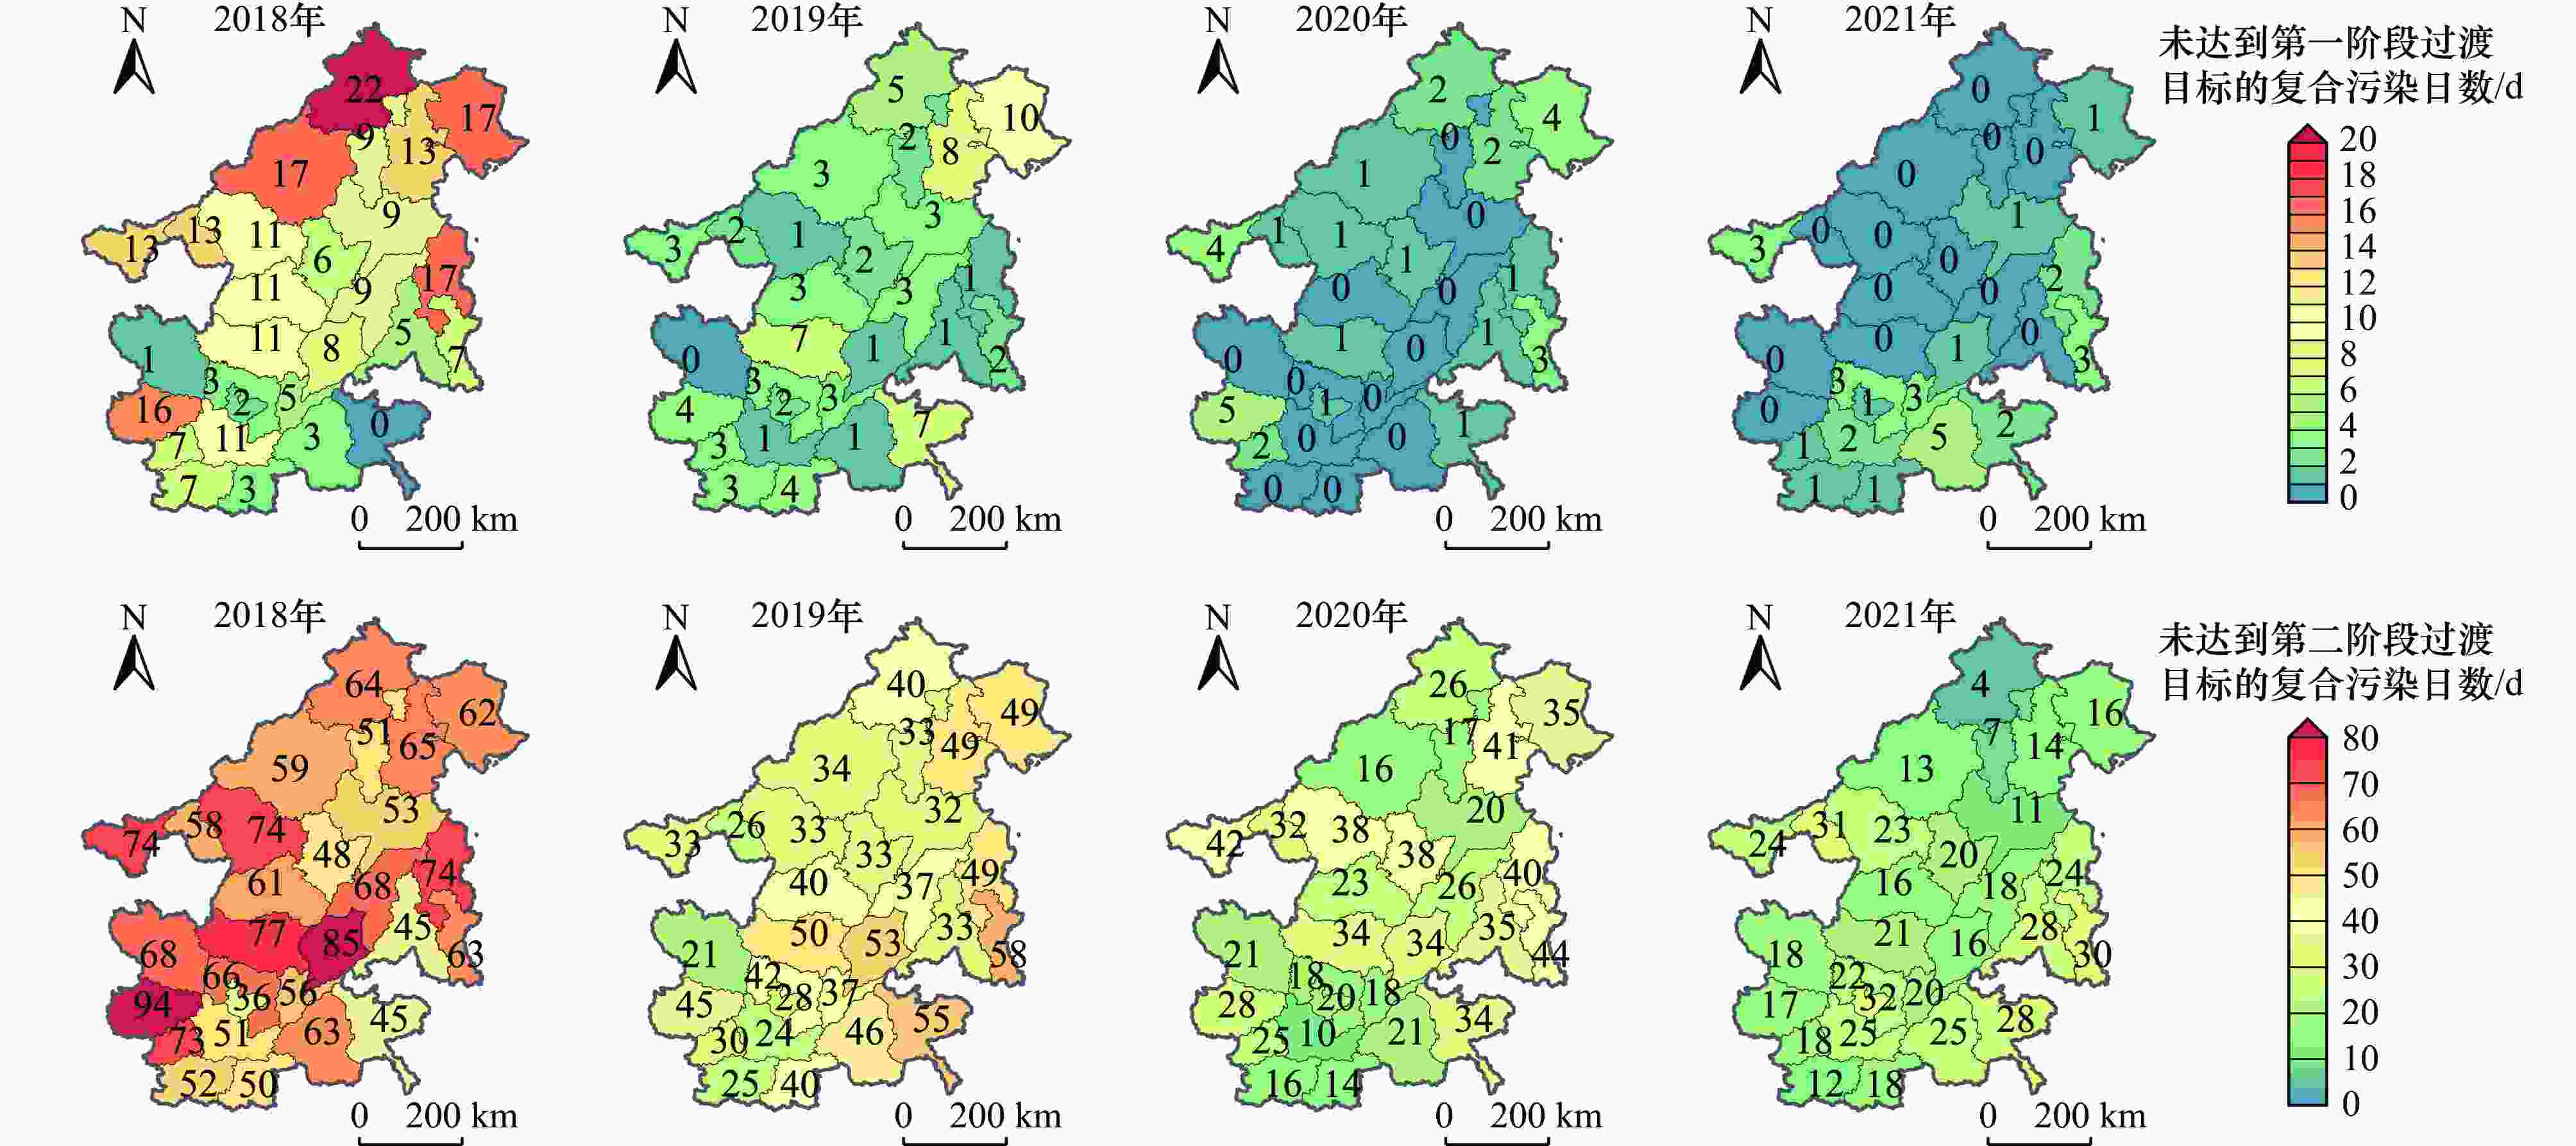
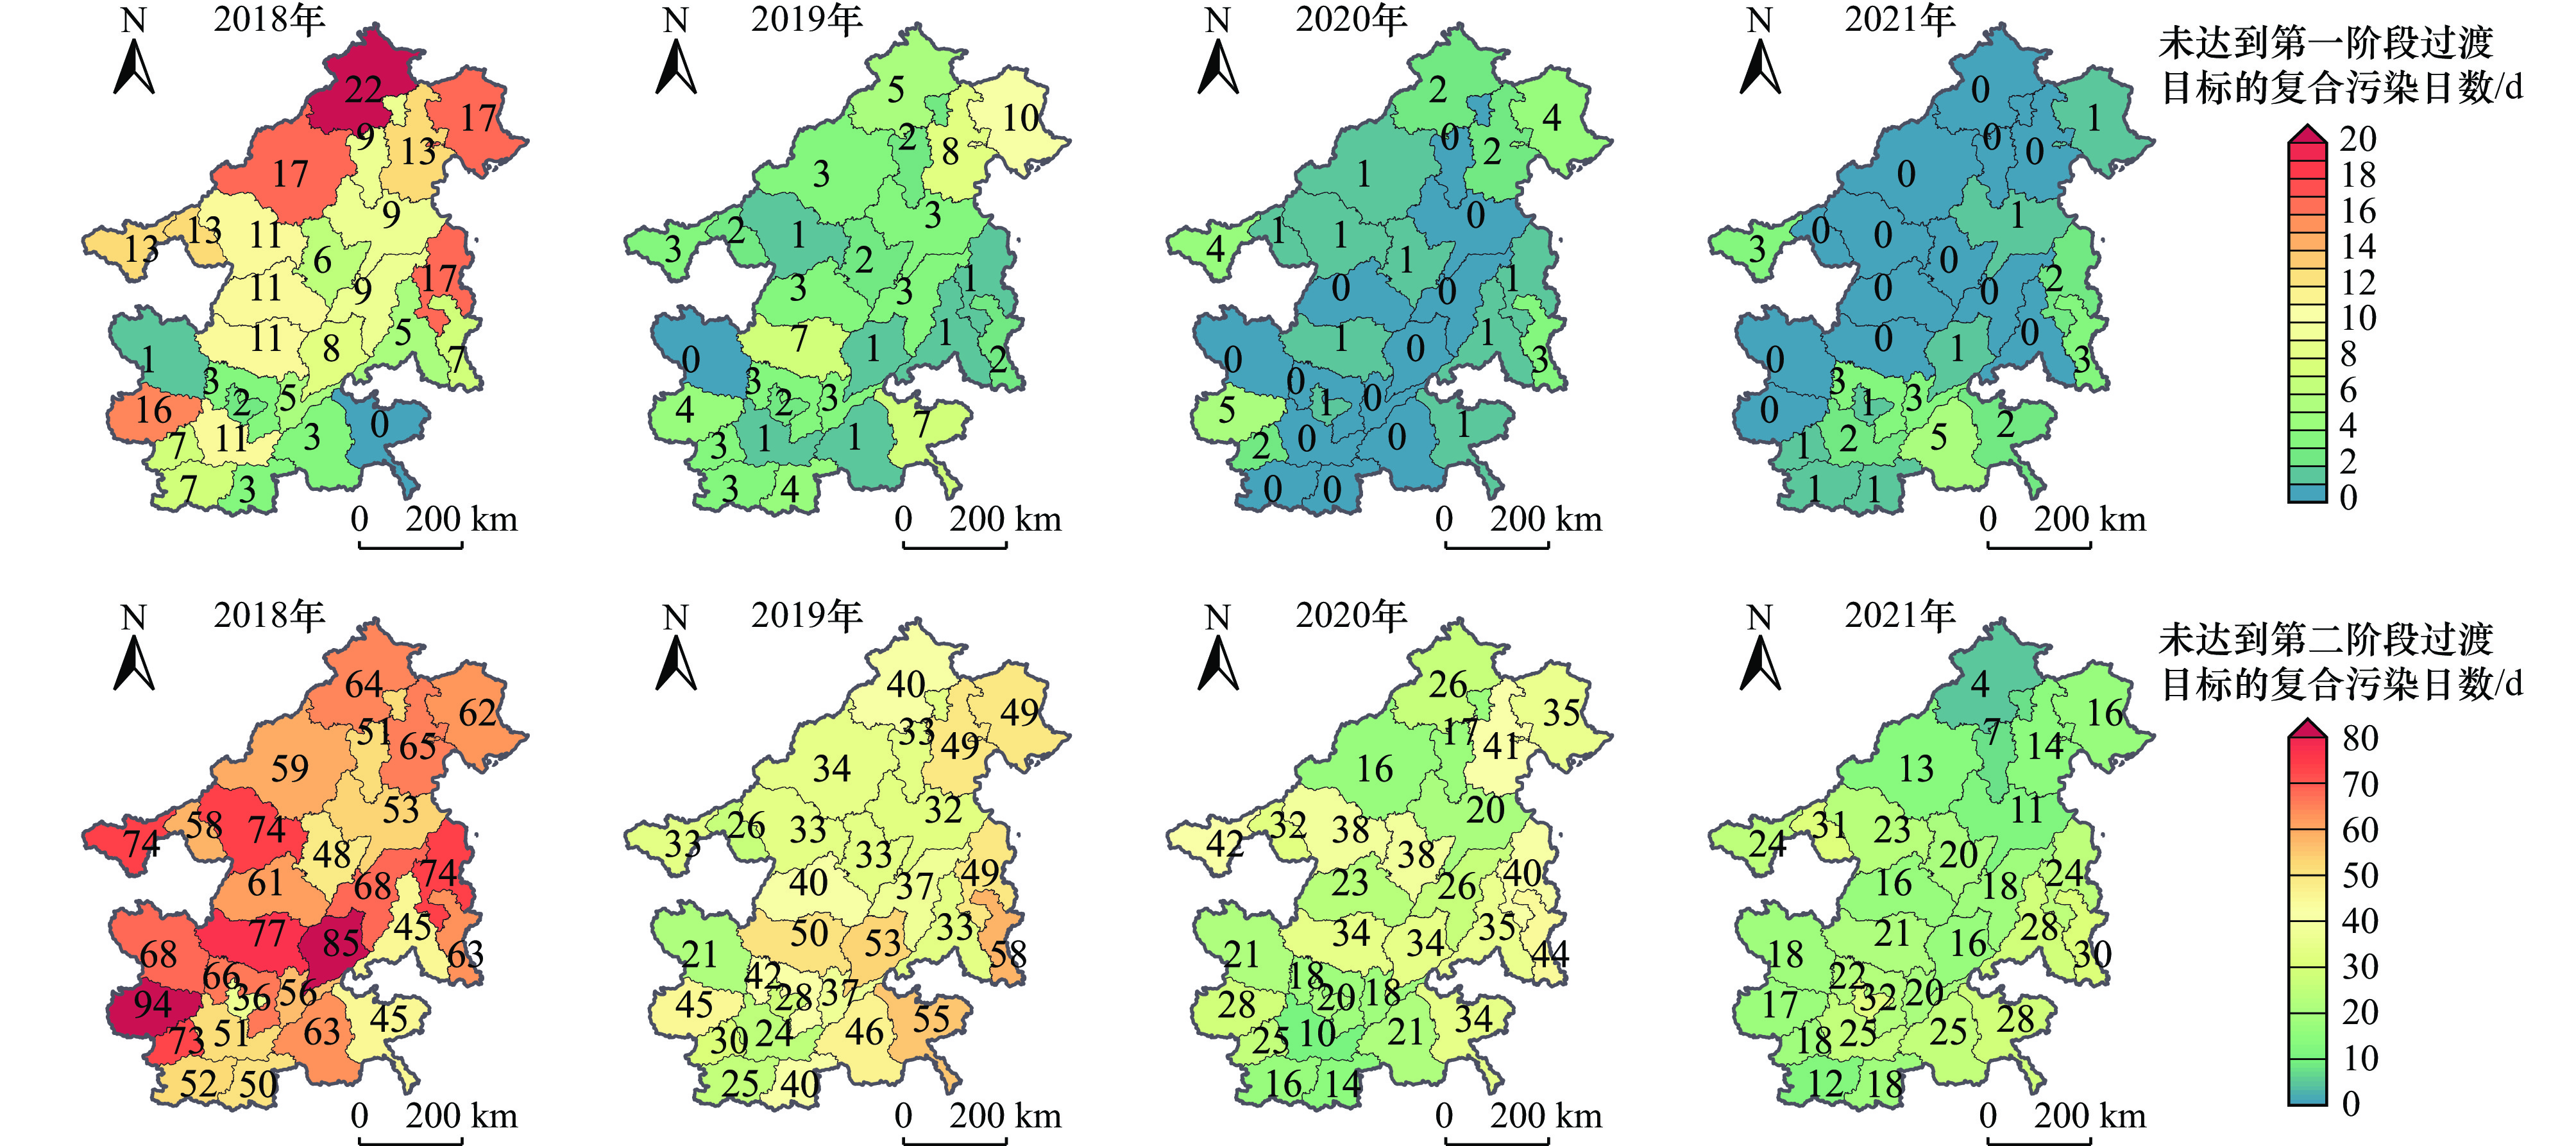
图 8 2018—2021年“2+26”城市未达到世界卫生组织第一阶段过渡目标与第二阶段过渡目标的PM2.5与O3复合污染日数
Figure 8. The number of combined PM2.5 and O3 pollution days failing to the first interim target and the second interim target in ‘2+26’ cities from 2018 to 2021
表 1 2018—2021年“2+26”城市气象条件对PM2.5与O3-8 h浓度的相对贡献率
Table 1. Relative contribution of meteorological factors to PM2.5 and O3-8 h in ‘2+26’ cities from 2018 to 2021
城市 气象条件的相对贡献率/% 城市 气象条件的相对贡献率/% 城市 气象条件的相对贡献率/% PM2.5浓度 O3-8 h浓度 PM2.5浓度 O3-8 h浓度 PM2.5浓度 O3-8 h浓度 北京市 65 63 太原市 62 228 菏泽市 51 80 天津市 56 51 阳泉市 81 64 郑州市 42 184 石家庄市 103 91 长治市 65 68 开封市 49 86 唐山市 62 63 晋城市 91 88 安阳市 54 95 邯郸市 64 66 济南市 12 53 鹤壁市 81 63 保定市 74 73 淄博市 17 65 新乡市 34 67 沧州市 31 58 济宁市 −1 2991) 94 焦作市 53 91 邢台市 60 77 德州市 25 44 濮阳市 65 49 廊坊市 52 104 聊城市 61 87 衡水市 52 73 滨州市 23 54 注:1)代表未通过0.05的显著性检验,其他均通过了0.05的显著性检验.  下载: 导出CSV
表 2 2018—2021年“2+26”城市PM2.5与O3-8 h浓度变化关系类型的比例
Table 2. Proportion of the relationship types between PM2.5 and O3-8 h concentrations in ‘2+26’ cities from 2018 to 2021
城市 占比/% 城市 占比/% B型 P型 O型 N型 B型 P型 O型 N型 北京市 27.6 28.3 22.8 21.3 济南市 31.0 22.4 20.5 26.1 天津市 28.3 26.0 21.3 24.4 淄博市 31.0 20.1 20.8 28.1 石家庄市 27.9 27.3 22.0 22.8 济宁市 31.2 21.2 20.3 27.3 唐山市 28.0 26.6 23.8 21.6 德州市 31.8 22.4 18.6 27.2 邯郸市 28.8 24.2 23.3 23.8 聊城市 32.8 22.4 18.9 25.9 保定市 28.5 26.6 22.4 22.5 滨州市 31.6 20.9 19.9 27.6 沧州市 29.7 22.9 22.3 25.1 菏泽市 31.7 21.4 20.1 26.8 邢台市 27.2 26.8 22.4 23.6 郑州市 27.6 24.9 23.3 24.3 廊坊市 27.5 26.0 24.2 22.4 开封市 30.5 22.7 21.3 25.4 衡水市 31.5 22.6 21.3 24.5 安阳市 28.8 23.9 23.1 24.1 太原市 28.7 25.6 22.1 23.6 鹤壁市 28.1 24.7 22.4 24.8 阳泉市 29.4 23.9 21.7 25.0 新乡市 28.3 23.9 21.7 26.0 长治市 27.6 25.2 24.4 22.8 焦作市 26.1 25.6 23.8 24.5 晋城市 31.4 22.0 19.6 27.1 濮阳市 28.5 23.0 22.8 25.7
下载: 导出CSV
表 3 2018—2021年PM2.5与O3-8 h浓度变化关系类型的逐月天数
Table 3. Days of the relationship types between PM2.5 and O3-8 h concentrations by month in ‘2+26’ cities from 2018 to 2021
类型 天数/d 1月 2月 3月 4月 5月 6月 7月 8月 9月 10月 11月 12月 B型 24 30 37 40 38 37 37 37 38 40 27 20 P型 41 30 27 19 22 21 24 22 21 26 37 42 O型 33 27 28 24 26 22 23 21 19 21 25 32 N型 19 24 27 30 32 34 35 37 33 29 24 19
下载: 导出CSV
表 4 气象耦合类型中B型的占比
Table 4. Proportions of type B under different meteorological coupling types
k 气象因子当日值与前1天的差值 样本量/个 样本量占比/% B型占比/% ΔT ΔRH ΔV85 $ \Delta \text{SSRD} $ $ \Delta \text{BLH} $ 1 + 20 514 53 42 1 − 18 125 47 15 2 + + 8 033 21 47 2 + − 12 481 32 38 2 + + 11 534 30 46 2 + + 11 448 30 44 3 + + + 3 027 8 55 3 + + + 4 218 11 54 3 + + + 3 620 9 50 4 + + + + 1 574 4 58 4 + + + + 1 536 4 58 注:k代表选取的气象因子数;Δ代表气象因子当日值与前1天的差值,+代表差值为正值,−代表差值为零或负值.
下载: 导出CSV
-
[1] ZHAO S P,YIN D Y,YU Y,et al.PM2.5 and O3 pollution during 2015-2019 over 367 Chinese cities:spatiotemporal variations,meteorological and topographical impacts[J].Environmental Pollution,2020,264:114694. doi: 10.1016/j.envpol.2020.114694 [2] QU L L,LIU S J,MA L L,et al.Evaluating the meteorological normalized PM2.5 trend (2014-2019) in the ‘2+26’ region of China using an ensemble learning technique[J].Environmental Pollution,2020,266:115346. doi: 10.1016/j.envpol.2020.115346 [3] ZHANG Z Z,WANG W X,CHENG M M,et al.The contribution of residential coal combustion to PM2.5 pollution over China's Beijing-Tianjin-Hebei Region in winter[J].Atmospheric Environment,2017,159:147-161. doi: 10.1016/j.atmosenv.2017.03.054 [4] LONG X,TIE X X,CAO J J,et al.Impact of crop field burning and mountains on heavy haze in the North China Plain:a case study[J].Atmospheric Chemistry and Physics,2016,16(15):9675-9691. doi: 10.5194/acp-16-9675-2016 [5] WU G X,TIAN W L,ZHANG L,et al.The Chinese Spring Festival impact on air quality in China:a critical review[J].International Journal of Environmental Research and Public Health,2022,19(15):9074. doi: 10.3390/ijerph19159074 [6] 孙峰,姚欢,刘保献,等.2013—2019年京津冀及周边地区PM2.5重污染特征[J].中国环境监测,2021,37(4):46-53.SUN F,YAO H,LIU B X,et al.Characteristics of PM2.5 heavy pollution in Beijing-Tianjin-Hebei and surrounding areas from 2013 to 2019[J].Environmental Monitoring in China,2021,37(4):46-53. [7] 井元元,李宏宇,张婧,等.1961—2017年华北区域大气自净能力变化特征及其影响因素分析[J].热带气象学报,2021,37(2):233-244.JING Y Y,LI H Y,ZHANG J,et al.Analysis of characteristics and influencing factors of atmospheric self-purification capacity in North China during 1961-2017[J].Journal of Tropical Meteorology,2021,37(2):233-244. [8] JIN X P,CAI X H,YU M Y,et al.Diagnostic analysis of wintertime PM2.5 pollution in the North China Plain:the impacts of regional transport and atmospheric boundary layer variation[J].Atmospheric Environment,2020,224:117346. doi: 10.1016/j.atmosenv.2020.117346 [9] ZHANG W H,LI W S,AN X D,et al.Numerical study of the amplification effects of cold-front passage on air pollution over the North China Plain[J].Science of the Total Environment,2022,833:155231. doi: 10.1016/j.scitotenv.2022.155231 [10] DANG R J,LIAO H.Severe winter haze days in the Beijing-Tianjin-Hebei Region from 1985 to 2017 and the roles of anthropogenic emissions and meteorology[J].Atmospheric Chemistry and Physics,2019,19(16):10801-10816. doi: 10.5194/acp-19-10801-2019 [11] ZHANG X Y,XU X D,DING Y H,et al.The impact of meteorological changes from 2013 to 2017 on PM2.5 mass reduction in key regions in China[J].Science China:Earth Sciencess,2019,62(12):1885-1902. doi: 10.1007/s11430-019-9343-3 [12] 李慧,王淑兰,张文杰,等.京津冀及周边地区“2+26”城市空气质量特征及其影响因素[J].环境科学研究,2021,34(1):172-184. doi: 10.13198/j.issn.1001-6929.2020.12.26LI H,WANG S L,ZHANG W J,et al.Characteristics and influencing factors of urban air quality in Beijing-Tianjin-Hebei and its surrounding areas (‘2+26’ cities)[J].Research of Environmental Sciences,2021,34(1):172-184. doi: 10.13198/j.issn.1001-6929.2020.12.26 [13] 姜华,高健,李红,等.我国大气污染协同防控理论框架初探[J].环境科学研究,2022,35(3):601-610.JIANG H,GAO J,LI H,et al.Preliminary research on theoretical framework of cooperative control of air pollution in China[J].Research of Environmental Sciences,2022,35(3):601-610. [14] WEI J,LI Z Q,LI K,et al.Full-coverage mapping and spatiotemporal variations of ground-level ozone (O3) pollution from 2013 to 2020 across China[J].Remote Sensing of Environment,2022,270:112775. doi: 10.1016/j.rse.2021.112775 [15] LI C L,LIU Y F,CHENG B F,et al.A comprehensive investigation on volatile organic compounds (VOCs) in 2018 in Beijing,China:characteristics,sources and behaviours in response to O3 formation[J].Science of the Total Environment,2022,806:150247. doi: 10.1016/j.scitotenv.2021.150247 [16] DANG R J,LIAO H,FU Y.Quantifying the anthropogenic and meteorological influences on summertime surface ozone in China over 2012-2017[J].Science of the Total Environment,2021,754:142394. doi: 10.1016/j.scitotenv.2020.142394 [17] GAO J,ZHANG J,LI H,et al.Comparative study of volatile organic compounds in ambient air using observed mixing ratios and initial mixing ratios taking chemical loss into account:a case study in a typical urban area in Beijing[J].Science of the Total Environment,2018,628/629:791-804. doi: 10.1016/j.scitotenv.2018.01.175 [18] MA P F,MAO H Q,ZHANG J H,et al.Satellite monitoring of stratospheric ozone intrusion exceptional events:a typical case of China in 2019[J].Atmospheric Pollution Research,2022,13(2):101297. doi: 10.1016/j.apr.2021.101297 [19] ZHANG Y J,ZHAO Y C,LI J,et al.Modeling ozone source apportionment and performing sensitivity analysis in summer on the North China plain[J].Atmosphere,2020,11(9):992. doi: 10.3390/atmos11090992 [20] 花丛,江琪,迟茜元,等.我国中东部地区2015—2020年夏半年PM2.5和臭氧复合污染气象特征分析[J].环境科学研究,2022,35(3):650-658.HUA C,JIANG Q,CHI X Y,et al.Meteorological characteristics of PM2.5-O3 air combined pollution in central and eastern China in the summer half years of 2015-2020[J].Research of Environmental Sciences,2022,35(3):650-658. [21] GONG S L,LIU Y L,HE J J,et al.Multi-scale analysis of the impacts of meteorology and emissions on PM2.5 and O3 trends at various regions in China from 2013 to 2020 1:synoptic circulation patterns and pollution[J].Science of the Total Environment,2022,815:152770. doi: 10.1016/j.scitotenv.2021.152770 [22] ZHOU L H,ZHANG J,LU T W,et al.Pollution patterns and their meteorological analysis all over China[J].Atmospheric Environment,2021,246:118108. doi: 10.1016/j.atmosenv.2020.118108 [23] YANG Z,YANG J,LI M M,et al.Nonlinear and lagged meteorological effects on daily levels of ambient PM2.5 and O3:evidence from 284 Chinese cities[J].Journal of Cleaner Production,2021,278:123931. doi: 10.1016/j.jclepro.2020.123931 [24] GONG S L,ZHANG L,LIU C,et al.Multi-scale analysis of the impacts of meteorology and emissions on PM2.5 and O3 trends at various regions in China from 2013 to 2020 2.key weather elements and emissions[J].Science of the Total Environment,2022,824:153847. doi: 10.1016/j.scitotenv.2022.153847 [25] DU H Y,LI J,WANG Z F,et al.Assessment of the effect of meteorological and emission variations on winter PM2.5 over the North China Plain in the three-year action plan against air pollution in 2018-2020[J].Atmospheric Research,2022,280:106395. doi: 10.1016/j.atmosres.2022.106395 [26] WANG P F,GUO H,HU J L,et al.Responses of PM2.5 and O3 concentrations to changes of meteorology and emissions in China[J].Science of the Total Environment,2019,662:297-306. doi: 10.1016/j.scitotenv.2019.01.227 [27] CHENG N L,CHENG B F,LI S S,et al.Effects of meteorology and emission reduction measures on air pollution in Beijing during heating seasons[J].Atmospheric Pollution Research,2019,10(3):971-979. doi: 10.1016/j.apr.2019.01.005 [28] ESKRIDGE R E,KU J Y,RAO S T,et al.Separating different scales of motion in time series of meteorological variables[J].Bulletin of the American Meteorological Society,1997,78(7):1473-1483. doi: 10.1175/1520-0477(1997)078<1473:SDSOMI>2.0.CO;2 [29] FANG C S,QIU J X,LI J,et al.Analysis of the meteorological impact on PM2.5 pollution in Changchun based on KZ filter and WRF-CMAQ[J].Atmospheric Environment,2022,271:118924. doi: 10.1016/j.atmosenv.2021.118924 [30] GAO S,BAI Z P,LIANG S,et al.Simulation of surface ozone over Hebei Province,China using Kolmogorov-Zurbenko and artificial neural network (KZ-ANN) combined model[J].Atmospheric Environment,2021,261:118599. doi: 10.1016/j.atmosenv.2021.118599 [31] RAO S T,ZURBENKO I G.Detecting and tracking changes in ozone air quality[J].Journal of the Air & Waste Management Association,1994,44(9):1089-1092. [32] SUN X Y,ZHAO T L,BAI Y Q,et al.Meteorology impact on PM2.5 change over a receptor region in the regional transport of air pollutants:observational study of recent emission reductions in Central China[J].Atmospheric Chemistry and Physics,2022,22(5):3579-3593. doi: 10.5194/acp-22-3579-2022 [33] WISE E K,COMRIE A C.Extending the Kolmogorov-Zurbenko filter:application to ozone,particulate matter,and meteorological trends[J].Journal of the Air & Waste Management Association,2005,55(8):1208-1216. [34] 张运江,雷若媛,崔世杰,等.2015—2020年我国主要城市PM2.5和O3污染时空变化趋势和影响因素[J].科学通报,2022,67(18):2029-2042.ZHANG Y J,LEI R Y,CUI S J,et al.Spatiotemporal trends and impact factors of PM2.5 and O3 pollution in major cities in China during 2015-2020[J].Chinese Science Bulletin,2022,67(18):2029-2042. [35] MILANCHUS M L,RAO S T,ZURBENKO I G.Evaluating the effectiveness of ozone management efforts in the presence of meteorological variability[J].Journal of the Air & Waste Management Association,1998,48(3):201-215. [36] 彭玏.京津冀城市大气污染传输通道区2000—2015年PM2.5时空格局研究[D].北京:北京林业大学,2019:8-10. [37] WENG X,FORSTER G L,NOWACK P.A machine learning approach to quantify meteorological drivers of ozone pollution in China from 2015 to 2019[J].Atmospheric Chemistry and Physics,2022,22(12):8385-8402. doi: 10.5194/acp-22-8385-2022 [38] GU R D,LI C F,LI D D,et al.The impact of rationalization and upgrading of industrial structure on carbon emissions in the Beijing-Tianjin-Hebei urban agglomeration[J].International Journal of Environmental Research and Public Health,2022,19(13):7997. doi: 10.3390/ijerph19137997 [39] CHEN Y C,LEI T C,YAO S,et al.PM2.5 prediction model based on combinational Hammerstein recurrent neural networks[J].Mathematics,2020,8(12):2178. doi: 10.3390/math8122178 [40] YU P,NIAN D,QIAO P J,et al.Memory behaviors of air pollutions and their spatial patterns in China[J].Frontiers in Physics,2022,10:875357. doi: 10.3389/fphy.2022.875357 -


 点击查看大图
计量
- 文章访问数: 545
- HTML全文浏览量: 85
- PDF下载量: 289
- 被引次数: 0
