


Estimation of CO2 Emissions from the Transport Sector in Guangdong Province, China and Analysis of Factors Affecting Emissions
-
摘要: 交通领域是二氧化碳排放的重要领域,为研究广东省的交通碳排放及影响因素,利用IPCC(联合国政府间气候变化专门委员会)在温室气体清单指南中提供的方法估算了广东交通碳排放量,并应用LMDI分解法(对数平均指数法)对广东交通碳排放进行因素分解分析.结果表明:① 2001-2010年广东交通碳排放量从1 950.98×10⁴ t增至6 068.41×10⁴ t,其中交通运输业碳排放是广东交通碳排放的主体,私人交通碳排放已成为广东交通碳排放不可忽视的组成部分.② 交通运输业中的公路碳排放量占比最大,占56%~64%;铁路的碳排放量占比最小,占0.6%~1.6%;水运具有较大的节能优势;民航单位周转量碳排放量最高.③ 交通运输业发展水平、运输结构、私人汽车数量规模对广东交通碳排放增加的贡献率分别为68.79%、36.14%、18.66%,是拉动广东交通碳排放增长的主要因素;运输强度与能源强度的贡献率分别为-18.1%、-6.46%,是抑制交通碳排放增长的因素.广东可以通过采取优化交通运输结构、使用替代清洁能源等措施减少交通碳排放.Abstract: The transport sector is a major contributor of CO2 emissions. The emissions from the transport sector in Guangdong province were estimated in accordance with the IPCC Guidelines for National Greenhouse Gas Inventories. The logarithmic mean Divisia index was used to measure the influence of commercial transport sector development, transport modal shift, private vehicle number, energy consumption per private vehicle, carbon emission coefficient, transport intensity and energy intensity on the CO2 emissions of the Guangdong transport sector. The results showed that:(1) CO2 emissions of the transport sector in Guangdong province increased from 19.51 million tons in 2001 to 60.68 million tons in 2010. The commercial transport sector was the major contributor of emissions, and private vehicle CO2 emissions were indispensable. (2) CO2 emissions from highways presented the largest share at 56%-64%, whereas the smallest share was from railways, which accounted for only 0.6%-1.6% of commercial transport sector CO2 emissions. Aviation presented the highest CO2 emissions per unit turnover, while waterways showed the lowest. (3) Commercial transport sector development, transport modal shift and private vehicle number positively affected the growth of emissions, with contributions of 68.79%, 36.13% and 18.66% respectively. By contrast, transport and energy intensities contributed negatively, with -18.1% and -6.46%, respectively. Therefore, the development of commercial transport industry, deterioration of transport modes and growing demand for private vehicles were responsible for the increasing CO2 emissions of the transport sector, whereas transport and energy efficiencies limited the increase in emissions. Transport sector CO2 emissions can be reduced through transport mode improvement and clean energy utilization.
-
Key words:
- transport sector carbon emissions /
- affecting factors /
- LMDI model /
- Guangdong
-

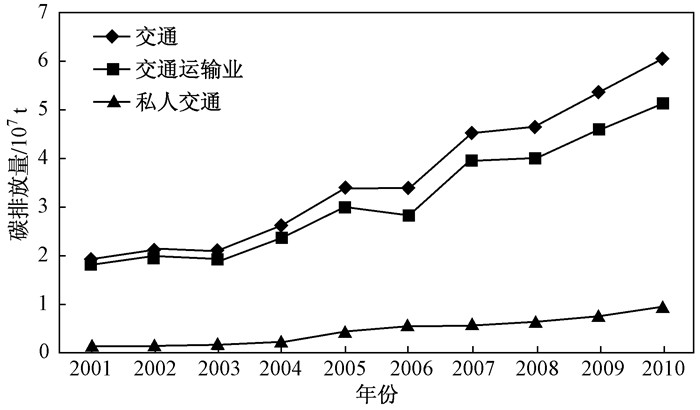
图 1 广东交通碳排放量、交通运输业碳排放量及私人交通碳排放量
Figure 1. CO2 emissions of transport sector in Guangdong:commercial transport sector and private vehicle

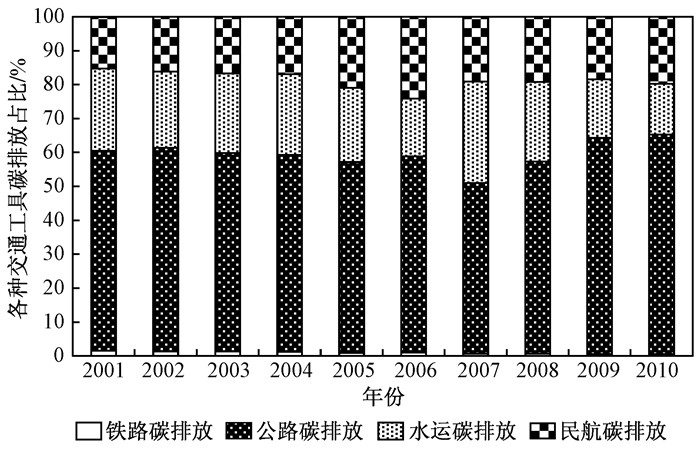
图 2 各种交通运输工具碳排放占比的变化
Figure 2. Contributions of commercial transport sector CO2emissions by each transport mode

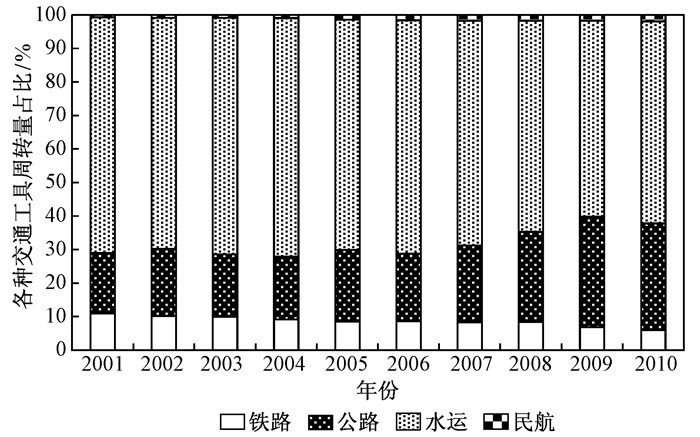
图 3 各种交通运输工具周转量占比的变化
Figure 3. Contributions of traffic turnover by each transport mode

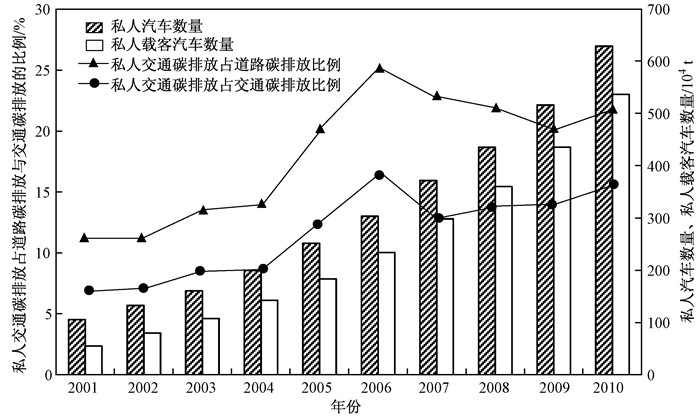
图 4 私人汽车、私人载客汽车数量及私人交通碳排放占道路碳排放、交通碳排放的比例
Figure 4. Private vehicle numbers, private passenger vehicle numbers and the proportion of private vehicle CO2 emissions to road and transport sector CO2 emissions
表 2 广东交通碳排放影响因素分解贡献值与贡献率
Table 2. Decomposition effect of CO2 emissions from the transport sector
时间 贡献值/(104 t) 交通能源碳排放因子效应(ΔCYSE) 能源强度效应(ΔCYI) 运输结构效应(ΔCYG) 运输强度效应(ΔCYF) 运输业发展水平效应(ΔCY) 私人汽车单位车辆能耗效应(ΔCSI) 私人汽车数量规模效应(ΔCk) 2001—2002年 4.91 4.60 166.97 -124.89 115.94 -17.06 32.49 2002—2003年 4.60 30.39 -70.82 -139.22 115.72 -5.80 31.65 2003—2004年 -1.55 -34.21 27.93 215.30 244.42 6.58 44.20 2004—2005年 1.17 139.12 393.57 -374.67 459.60 126.75 72.52 2005—2006年 0.36 -186.10 -20.23 -400.50 438.65 37.76 91.06 2006—2007年 -1.34 649.21 272.54 -133.01 347.16 -84.21 116.01 2007—2008年 -0.66 -220.99 273.70 -331.46 318.76 -42.10 96.81 2008—2009年 0.62 -312.29 464.77 203.82 242.94 -13.87 118.09 2009—2010年 0.03 -335.80 -20.57 339.39 549.26 23.99 165.43 2001—2010年 8.14 -266.06 1 487.86 -745.25 2 832.44 32.03 768.26 2001—2010年贡献率/% 0.20 -6.46 36.14 -18.10 68.79 0.78 18.66  下载: 导出CSV
表 1 各类能源二氧化碳排放系数
Table 1. Carbon emissions coefficient of different energy sources
能源种类 平均低位发热量/(kJ/kg) 单位热值含碳量/(kg/GJ) 碳氧化率/% 二氧化碳排放系数/(kg/kg) 汽油 43 070 18.9 100 2.98 柴油 42 652 20.2 100 3.16 燃料油 41 816 21.1 100 3.24 煤油 43 070 19.6 100 3.10
下载: 导出CSV
-
[1] IEA.CO2 emissions from fuel combustion highlights 2016[EB/OL].Paris:International Energy Agency, 2016[2016-10-28]. http://www.iea.org/publications/freepublications/publication/co2-emissions-from-fuel-combustion-highlights-2016.html. https://econpapers.repec.org/article/uwplandec/v_3a92_3ay_3a2016_3ai_3a3_3ap_3a534-554.htm [2] CUI Q, LI Y.An empirical study on the influencing factors of transportation carbon efficiency:evidences from fifteen countries[J].Applied Energy, 2015, 141:209-217. doi: 10.1016/j.apenergy.2014.12.040 [3] KO J, PARK D, LIM H, et al.Who produces the most CO2 emissions for trips in the Seoul metropolis area?[J].Transportation Research Part D:Transport and Environment, 2011, 16:358-364. doi: 10.1016/j.trd.2011.02.001 [4] BARLA P, MIRANDA-MORENO L F, LEE-GOSSELIN M.Urban travel CO2 emissions and land use:a case study for Quebec City[J].Transportation Research Part D:Transport and Environment, 2011, 16:423-428. doi: 10.1016/j.trd.2011.03.005 [5] EOM J, SCHIPPER L, THOMPSON L.We keep on truckin':trends in freight energy use and carbon emissions in 11 IEA countries[J].Energy Policy, 2012, 45:327-341. doi: 10.1016/j.enpol.2012.02.040 [6] DHAR S, SHUKLA P R.Low carbon scenarios for transport in India:co-benefits analysis[J].Energy Policy, 2015, 81(136):186-198. https://trid.trb.org/view.aspx?id=1353255 [7] ANABLE J, BRAND C, TRAN M, et al.Modelling transport energy demand:a socio-technical approach[J].Energy Policy, 2012, 41:125-138. doi: 10.1016/j.enpol.2010.08.020 [8] BRAND C, TRAN M, ANABLE J.The UK transport carbon model:an integrated life cycle approach to explore low carbon futures[J].Energy Policy, 2012, 41:107-124. doi: 10.1016/j.enpol.2010.08.019 [9] LIMANOND T, JOMNONKWAO S, SRIKAEW A.Projection of future transport energy demand of Thailand[J].Energy Policy, 2011, 39(5):2754-2763. doi: 10.1016/j.enpol.2011.02.045 [10] ALAM A, DIAB E, EL-GENEIDY A, et al.A simulation of transit bus emissions along an urban corridor:evaluating changes under various service improvement strategies[J].Transportation Research Part D:Transport and Environment, 2014, 31(5):189-198. https://trid.trb.org/view/1322067 [11] ALAM A, HATZOPOULOU M.Investigating the isolated and combined effects of congestion, roadway grade, passenger load, and alternative fuels on transit bus emissions[J].Transportation Research Part D:Transport and Environment, 2014, 29(6):12-21. https://trid.trb.org/view.aspx?id=1316282 [12] OSHIRO K, MASUI T.Diffusion of low emission vehicles and their impact on CO2 emission reduction in Japan[J].Energy Policy, 2015, 81(140):215-225. http://vbn.aau.dk/en/publications/reviewing-energyplan-simulations-and-performance-indicator-applications-in-energyplan-simulations(f6262522-38be-45af-ae4f-cdc9605fea55).html [13] KⅡ M, AKIMOTO K, DOIK.Measuring the impact of urban policies on transportation energy saving using a land use-transport model[J].Latss Research, 2014, 37(2):98-109. https://trid.trb.org/view.aspx?id=1305376 [14] BRAND C, ANABLE J, TRAN M.Accelerating the transformation to a low carbon passenger transport system:the role of car purchase taxes, feebates, road taxes and scrappage incentives in the UK[J].Transportation Research Part A:Policy and Practice, 2013, 49:132-148. doi: 10.1016/j.tra.2013.01.010 [15] 贾顺平, 毛保华, 刘爽, 等.中国交通运输能源消耗水平测算与分析[J].交通运输系统工程与信息, 2010, 10(1):22-27. http://youxian.cnki.com.cn/yxdetail.aspx?filename=HJXX20170621000&dbname=CAPJ2015JIA Shunping, MAO Baohua, LIU Shuang, et al.Calculation and analysis of transportation energy consumption level in China[J].Journal of Transportation Systems Engineering and Information Technology, 2010, 10(1):22-27. http://youxian.cnki.com.cn/yxdetail.aspx?filename=HJXX20170621000&dbname=CAPJ2015 [16] 张秀媛, 杨新苗, 闫琰.城市交通能耗和碳排放统计测算方法研究[J].中国软科学, 2014(6):142-150. http://www.cnki.com.cn/Article/CJFDTOTAL-ZGRK201406013.htmZHANG Xiuyuan, YANG Xinmiao, YAN Yan.Statistical estimation method for energy consumption and carbon emissions by urban transport[J].China Soft Science, 2014(6):142-150. http://www.cnki.com.cn/Article/CJFDTOTAL-ZGRK201406013.htm [17] 赵敏, 张卫国, 俞立中.上海市居民出行方式与城市交通CO2排放及减排对策[J].环境科学研究, 2009, 22(6):747-752.ZHAO Min, ZHANG Weiguo, YU Lizhong.Resident travel modes and CO2 emissions by traffic in Shanghai City[J].Research of Environmental Sciences, 2009, 22(6):747-752. [18] KAKOUEI A, VATANI A, IDRIS A K B.An estimation of traffic related CO2 emissions from motor vehicles in the capital city of, Iran[J].Iranian Journal of Environmental Health Science & Engineering, 2012, 9(1):1-5. https://econpapers.repec.org/article/eeerensus/v_3a28_3ay_3a2013_3ai_3ac_3ap_3a777-787.htm [19] FAN F, LEI Y.Decomposition analysis of energy-related carbon emissions from the transportation sector in Beijing[J].Transportation Research Part D:Transport and Environment, 2016, 42:135-145. doi: 10.1016/j.trd.2015.11.001 [20] 吴开亚, 何彩虹, 王桂新, 等.上海市交通能源消费碳排放的测算与分解分析[J].经济地理, 2012, 32(11):45-51. http://www.cnki.com.cn/Article/CJFDTOTAL-JJDL201211007.htmWU Kaiya, HE Caihong, WANG Guixin, et al.Measurement and decomposition analysis on carbon emissions of transportation industry in Shanghai[J].Economic Geography, 2012, 32(11):45-51. http://www.cnki.com.cn/Article/CJFDTOTAL-JJDL201211007.htm [21] GUO B, GENG Y, FRANKE B, et al.Uncovering China's transport CO2 emissions patterns at the regional level[J].Energy Policy, 2014, 74:134-146. doi: 10.1016/j.enpol.2014.08.005 [22] WANG W W, ZHANG M, ZHOU M.Using LMDI method to analyze transport sector CO2 emissions in China[J].Energy, 2011, 36:5909-5915. doi: 10.1016/j.energy.2011.08.031 [23] TIMILSINA G R, SHRESTHA A.Factors affecting transport sector CO2 emissions growth in Latin American and Caribbean countries:an LMDI decomposition analysis[J].International Journal of Energy Research, 2009, 33(4):396-414. doi: 10.1002/er.v33:4 [24] LOO B P Y, LI L.Carbon dioxide emissions from passenger transport in China since 1949:implications for developing sustainable transport[J].Energy Policy, 2012, 50:464-476. doi: 10.1016/j.enpol.2012.07.044 [25] TIMILSINA G, SHRESTHA A.Transport sector CO2 emissions growth in Asia:underlying factors and policy options[J].Energy Policy, 2009, 37(11):4523-4539. doi: 10.1016/j.enpol.2009.06.009 [26] SCHIPPER L, SAENGER C, SUDARDSHAN A.Transport and carbon emissions in the United States:the long view[J].Energies, 2011, 4(4):563-581. http://cn.bing.com/academic/profile?id=912b77deaa0a0d11196df6d20ceff3e7&encoded=0&v=paper_preview&mkt=zh-cn [27] 蔡博峰, 曹东, 刘兰翠, 等.中国交通二氧化碳排放研究[J].气候变化研究进展, 2011, 7(3):197-203. http://www.cnki.com.cn/Article/CJFDTOTAL-QHBH201103010.htmCAI Bofeng, CAO Dong, LIU Lancui, et al.China transport CO2 emission study[J].Advances in Climate Change Research, 2011, 7(3):197-203. http://www.cnki.com.cn/Article/CJFDTOTAL-QHBH201103010.htm [28] ANG B W, LIU F L.A new energy decomposition method:perfect in decomposition and consistent in aggregation[J].Energy, 2001, 26:537-548. doi: 10.1016/S0360-5442(01)00022-6 [29] ANG B W.The LMDI approach to decomposition analysis:a practical guide[J].Energy Policy, 2005, 33:867-871. doi: 10.1016/j.enpol.2003.10.010 [30] ANG B W, LIU N.Handling zero values in the logarithmic mean Divisia index decomposition approach[J].Energy Policy, 2007, 35:238-246. doi: 10.1016/j.enpol.2005.11.001 [31] 亚洲开发银行与中国交通运输部合作项目. 中国公路交通资源优化利用上卷: 政策建议与行动计划[M]. 北京: 中国经济出版社, 2009: 106-107. [32] 李杨. 基于可持续发展理论的我国公路交通发展模式研究[D]. 大连: 大连海事大学, 2013: 55-57. [33] 王莉.国际金融危机对汽车行业的影响及应对策略[J].中国经贸导刊, 2009(11):23-24. doi: 10.3969/j.issn.1007-9777.2009.11.010 [34] 马静, 柴彦威, 刘志林.基于居民出行行为的北京市交通碳排放影响机理[J].地理学报, 2011, 66(8):1023-1032. doi: 10.11821/xb201108002MA Jing, CHAI Yanwei, LIU Zhilin.The mechanism of CO2 emissions from urban transport based on individuals' travel behavior in Beijing[J].Acta Geographica Sinica, 2011, 66(8):1023-1032. doi: 10.11821/xb201108002 -

 点击查看大图
计量
- 文章访问数: 1924
- HTML全文浏览量: 122
- PDF下载量: 1807
- 被引次数: 0
